Everyone agrees that the economic recovery has been disappointing. There is no consensus on the cause. Nearly everyone has missed the most crucial element:
The crisis of confidence.
Confidence is essential to economic success, as we have known for more than a century. Listen to this brief sound clip, instantly recognizable to many.
The background story is not so well-known. The TeachingHistory site provides an excellent description of the drafts of FDR's first Inaugural Address, and the changes involved. The most memorable line was actually taken from discussions in the business community, as noted here:
When confidence is lacking, we get less (not all or nothing, but less) of the following:
- Employers are less willing to expand -- new plants, new workers;
- Potential entrepreneurs are less willing to act -- new businesses, new jobs;
- Young families are less willing to buy new homes;
- Anyone worried about employment is less willing to make a major purchase;
- Banks are more reluctant to lend;
- And many other similar effects.
Without the ingredient of confidence, the economic engine is missing an element. It is time to retire the "pushing on a string analogy" which has outlived its usefulness. I suggest that we call this the "Confidence Gap."
We have all of the elements for the economic engine -- deferred demand, strong balance sheets, and potential profits for all. There is one thing missing. I think of it as the "spark plug gap" being a little too wide, but that is because my education includes the ignition coup of a young sailor with his cap at a jaunty angle.
Who is responsible for the "confidence gap?"
There are plenty of candidates, especially after last year's debt ceiling fiasco.
I'll offer some of my own expectations in the conclusion, but first let us do our regular review of last week's news.
Background on "Weighing the Week Ahead"
There are many good sources for a list of upcoming events. One source I especially like is the weekly post from the WSJ's Market Beat blog.
In contrast, I highlight a smaller group of events. My theme is an expert guess about what we will be watching on TV and reading in the mainstream media. It is a focus on what I think is important for my trading and client portfolios.
This is unlike my other articles where I develop a focused, logical argument with supporting data on a single theme. Here I am simply sharing my conclusions. Sometimes these are topics that I have already written about, and others are on my agenda. I am putting the news in context.
Readers often disagree with my conclusions. Do not be bashful. Join in and comment about what we should expect in the days ahead. This weekly piece emphasizes my opinions about what is really important and how to put the news in context. I have had great success with my approach, but feel free to disagree. That is what makes a market!
Last Week's Data
Each week I break down events into good and bad. Often there is "ugly" and on rare occasion something really good. My working definition of "good" has two components:
- The news is market-friendly. Our personal policy preferences are not relevant for this test. And especially -- no politics.
- It is better than expectations.
The news last week was very good, even better than the market result.
- Rail traffic is better, especially measured by intermodal traffic. See Todd Sullivan's take and his helpful chart.
- Sentiment (a contrarian indicator) is below the bullish average of the recent market rise (via Bespoke).
- Housing had a good initial reaction to the QE3 announcement (via Dr. Ed).
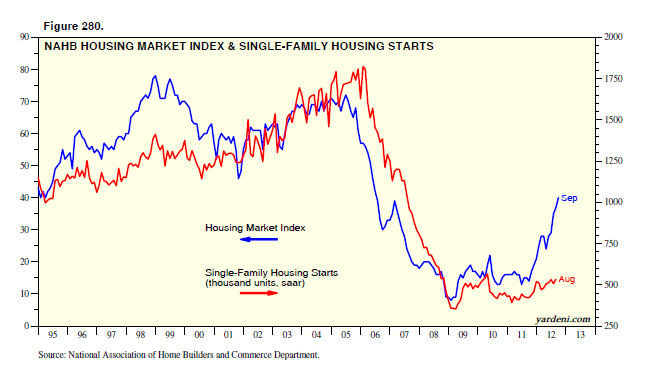
Home sales data
were encouraging (via Calculated Risk) where you can see a comprehensive look at sales and building permits as well as this revealing look at the improving inventory situation: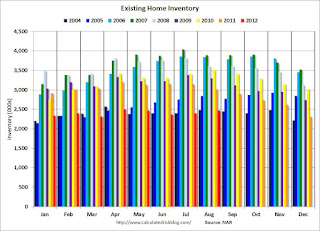
The Bad
There was plenty of bad news last week.
- Flash PMI indicators from Europe were weak (via multiple sources). I noted this source in last week's preview. There is a thirst for data because we are so interested in news from Europe and China. The same pundits who express skepticism about "surveys" rush to embrace this source. I am watching, but with some caution. I like to see a longer track record.
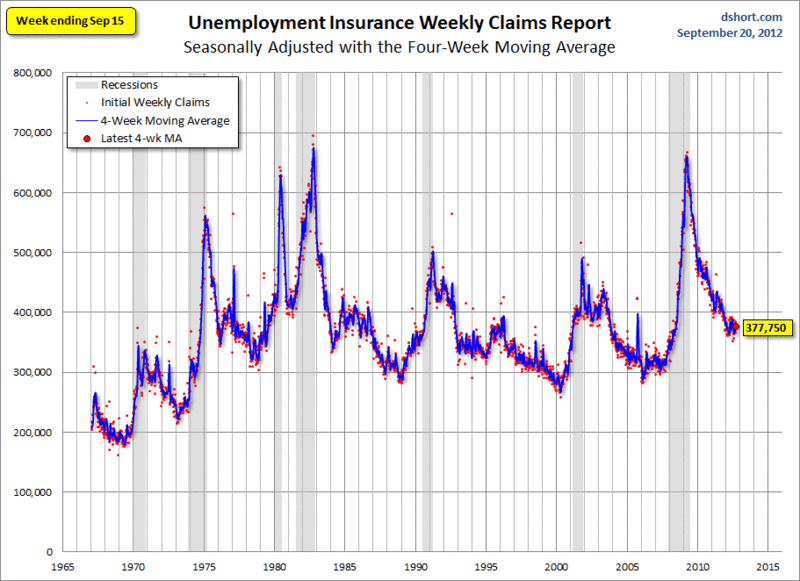
- Initial jobless claims remained in the danger zone. Seasonal factors might still be in play, but I continue to regard this as bad news. Here is the long-term perspective in the chart from Doug Short:
- Greece is headed back to the front burner for market worries. Our key source on that topic, The New Athenian, notes both the demanding requirements and the slow progress toward meeting Troika requirements. The Greek dilemma remains on the agenda for a Euro solution.
- Gasoline prices rise again -- up more than four cents. Check out this and other "mixed" high frequency indicators from Bonddad.
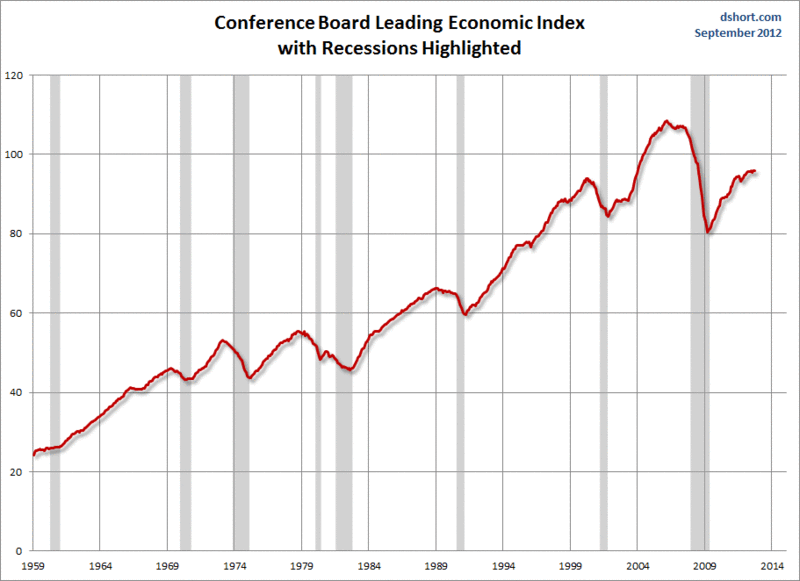
- Leading Economic Indicators had a slight decline. Doug Short puts this in historical perspective:
The Ugly
Denard -- not at his best. I am expecting a rebound from my favorite college player, but this is a great illustration of dispassionate investing versus emotion! I am cheering for Michigan -- as usual -- but not investing:)
Meanwhile, readers are invited to submit ugly news that I should have noted!
The Indicator Snapshot
It is important to keep the current news in perspective. My weekly snapshot includes the most important summary indicators:
- The St. Louis Financial Stress Index.
- The key measures from our "Felix" ETF model.
- An updated analysis of recession probability.
The SLFSI reports with a one-week lag. This means that the reported values do not include last week's market action. The SLFSI has moved a lot lower, and is now out of the trigger range of my pre-determined risk alarm. This is an excellent tool for managing risk objectively, and it has suggested the need for more caution. Before implementing this indicator our team did extensive research, discovering a "warning range" that deserves respect. We identified a reading of 1.1 or higher as a place to consider reducing positions.
The SLFSI is not a market-timing tool, since it does not attempt to predict how people will interpret events. It uses data, mostly from credit markets, to reach an objective risk assessment. The biggest profits come from going all-in when risk is high on this indicator, but so do the biggest losses.
The C-Score is a weekly interpretation of the best recession indicator I found, Bob Dieli's "aggregate spread."
Bob and I recently did some videos explaining the recession history. I am working on a post that will show how to use this method. As I have written for many months, there is no imminent recession concern. I recently showed the significance of by explaining the relationship to the business cycle.
The evidence against the ECRI recession forecast continues to mount. It is disappointing that those with the best forecasting records get so much less media attention. The idea that a recession has already started is losing credibility with most observers. I urge readers to check out the list of excellent updates from prior posts.
Readers might also want to review my new Recession Resource Page, which explains many of the concepts people get wrong.
The single best resource for the ECRI call and the ongoing debate is Doug Short. This week's article describes the complete history, the critics, and how it has played out. The post highlights the most important economic indicators used in identifying recessions, showing that none have rolled over. Doug updates the recession debate every week and includes a great chart of the "big four" indicators used by the NBER in recession dating.
This has become a mandatory weekly read for those who are still worried about a new recession. 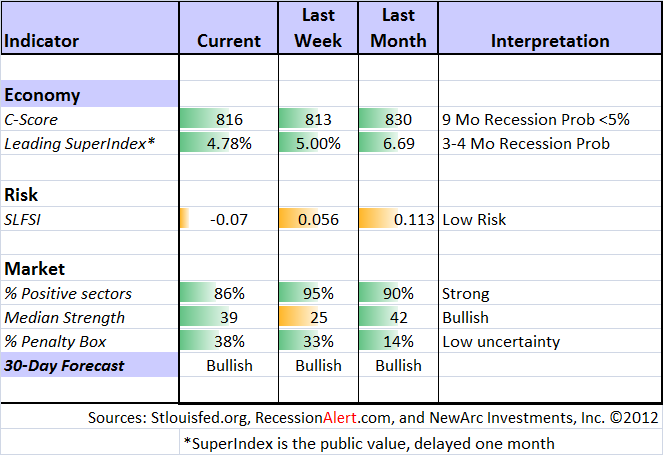
Our "Felix" model is the basis for our "official" vote in the weekly Ticker Sense Blogger Sentiment Poll. We have a long public record for these positions. This week we continued as bullish after a brief stint at "neutral." These are one-month forecasts for the poll, but Felix has a three-week horizon. The ratings have moved a little higher, and the confidence has improved from last week. It has been a close call over the last few weeks.
[For more on the penalty box see this article. For more on the system ratings, you can write to etf at newarc dot com for our free report package or to be added to the (free) weekly ETF email list. You can also write personally to me with questions or comments, and I'll do my best to answer.]
The Week Ahead
There is a busier calendar for data this week. As noted above, my grading of the reports relates to what I see as important.
The "A List" includes the following:
- Consumer Confidence (Conf Board) (T) as an important confirming concurrent indicator
- Initial claims (Th) which continue to provide the most up-to-date read on jobs and the economy.
The "B List" includes several reports:
- Michigan Sentiment (F) is as important as the Conference Board, but we already have the preliminary read for the month.
- Chicago PMI -- once again more significant because of the weekend before the national PMI. This is the most reliable of the regional indicators.
- Personal income and spending for August (F). Other indicators may seem fresher, but this is important confirmation and could move the market.
- Durable goods (TH) has the same significance and interpretation as Personal Income.
There will be assorted speeches by central bankers, but the key discussion will be about Spain. The market wants Spain to agree to a bit more austerity and request an official bailout. This news will be greeted as bullish, sending Spanish yields lower, the Euro higher, and US stocks higher as well.
This may seem counter-intuitive to some, but that will be the take. Watch for it.
Trading Time Frame
Felix has moved back into a marginally bullish posture over the last two weeks, but it has been a close call. In practice, the official forecast has mattered little to our trading positions. Felix became more aggressive in a timely fashion, near the start of the summer rally. Since we only require three buyable sectors, the trading accounts look for the "bull market somewhere" even when the overall picture is neutral. The ratings have been getting a little stronger, so we maintain the profitable trades.
Felix does not try to call tops and bottoms, but instead keeps us on the right side of major moves, either up or down.
Investor Time Frame
Many long-term investors have simply lost touch with reality. Here is an astounding research finding:
"One surprising finding shows that investors are likely so consumed by the negative economic news, including high unemployment and the weak housing market, that they haven't even noticed the strength of the stock market.
For example, when 1,000 investors were asked whether they thought the S&P was up or down during each of the past three years, 66% thought it was down in 2009, 48% thought it was down in 2010, and 53% thought it was down last year.
In fact, the S&P gained 26.5% in 2009, 15.1% in 2010, and 2.1% last year."
Those worried that it is "too late" to invest should read Eddy Elfenbein's nice post, The Market’s P/E Ratio Is Lower Now Than It Was Most of the Time from 1991 to 2010, including this chart: 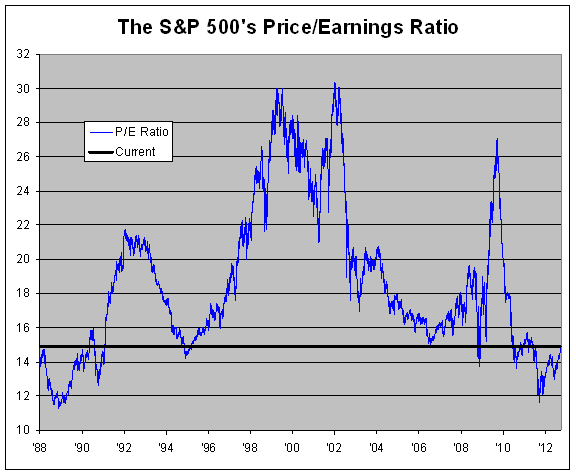
Understanding the attractive fundamental conditions is the first step for the long-term investor, but it does not mean that you should be going "all in."
How much risk should you take? The right answer is different for everyone, but too many people choose "zero." These investors do not follow the Buffett advice of buying when others are fearful. Then, when the market rallies, they are afraid that they are "too late." I wrote a new article, Stock Prices and the Fundamentals: Don't be Fooled, showing how to avoid this trap. The answer is not going "all in" since most of us have to pay more attention to short-term risk than does Mr. Buffett!
Should you worry about the "fiscal cliff?" The basic answer is "not yet." I explain why in two articles. The first reveals my one-word solution. The second offers my current expectations, and how I am investing for the long-term program.
If you have been following our regular advice, you have done the following:
- Replaced your bond mutual funds with individual bonds (bond funds are very risky!);
- Sold some calls against your modest dividend stocks to enhance yield to the 10% range; and
- Added some octane with a reasonable allocation of good stocks.
There is nothing more satisfying than getting yield and call premiums, even if stocks move sideways.
If you have not done so, it is certainly not too late. We have collected some of our recent recommendations in a new investor resource page -- a starting point for the long-term investor. (Comments and suggestions welcome!)
Final Thoughts on Confidence
There are some glimmers of improvement. The latest WSJ/NBC poll includes these two results (via Washington Post, where you can see their other six key takeaways):
- A burst of “right direction” optimism: Nearly four in 10 people said that the country is “headed in the right direction” — the highest that number has been in NBC-WSJ polling since January 2009. By way of comparison, in NBC-WSJ polling in August, July and June the “right direction” number never rose above 32 percent. Important piece of context: A majority of people — 55 percent — still say that things are off on the “wrong track”.
- Economy improving?: In a bounce similar to the “right direction” improvement noted above, 42 percent of people now believe the economy will get better over the next year, an improvement from the 36 percent who said the same just a month ago. That burst of optimism comes not from those who had previously been pessimistic — 18 percent in both the August and September NBC-WSJ poll said the economy would get worse — but rather from movement among those who had previously predicted the status quo (38 percent in August) and now feel more optimistic (32 percent in September).
This is only a start, but most readers probably are not seeing these indicators in their regular reading.
Tracking confidence measures of all sorts is important for investors. This is how we will discover that prospects are improving --- or not!
This week's upcoming data will provide updated information on consumer sentiment. We will see more on the candidates and general economic sentiment as well.
The Payoff -- If Confidence Returns to Normal
Some astute observers see plenty of upside. JP Morgan's Thomas Lee notes that if the S&P earnings yield merely equaled the high yield bond (a frequent past metric), the S&P 500 would be at 1600. Check out the entire article to see what else might happen before election day.
It is going to take heightened confidence before we see this, but it certainly could happen.
