Sometimes the week ahead, despite our relentless focus on markets, brings policy issues to the fore. Such was the case during the fiscal cliff countdown, and it is happening again.
I have strongly advised that investors remain agnostic about politics. It is more profitable to accept the reality of current policy. Figure out what investment is best for the times. For this reason I rarely opine about policy. I often identify what is most likely to happen, and which outcomes are market-friendly.
In this spirit I suggest that investors should be monitoring the slow and laborious process toward a compromise that will avoid the impending spending sequestration. Until now I have refrained from writing about this issue. Why this week? Two things.
- It will be a light week for other economic data, leaving plenty of media space and time to fill. My mission in the WTWA series is to forecast what will be on the agenda.
- The State of the Union speech might offer some real hints -- if you know what to look for.
Sequestration was adopted originally as part of the resolution to the 2011 debt ceiling impasse. The Budget Control Act of 2011 (Congress is great at misleading names for bills!) created a Congressional Joint Committee on Deficit Reduction. This "SuperCommittee" was evenly balanced, and failed to reach a bipartisan agreement within the time limit. Congress has acted to delay the implementation of these cuts, most recently as part of the so-called "fiscal cliff" resolution. D-Day is now March 1st, but the effects are already being felt in many ways.
While some now seem willing to allow sequestration provisions to take effect, no one really believes that the meat-axe approach is the preferred solution to U.S. budget problems. In fact, the original intent was exactly the opposite.
The issue is important. The automatic cuts will reduce expected economic growth by 0.7% according to the Congressional Budget Office. This will have a related effect on expected corporate earnings.
The timing is important, since Congress is about to go on an extended "President's Day Recess" starting Friday.
Background on the State of the Union
President Obama's second inaugural address was widely perceived as aggressive and partisan. The tradition for the State of the Union Address is different. While it lays out an agenda, it often strikes some bi-partisan and patriotic themes. It will and should be closely watched as a hint for the future. There are some preliminary leaks about the text, but even these may be trial balloons.
I have some thoughts on what to watch for in the SOTU speech which I'll report in the conclusion. First, let us do our regular update of last week's news and data.
Background on "Weighing the Week Ahead"
There are many good lists of upcoming events. One source I especially like is the weekly post from the WSJ's Market Beat blog. There is a nice combination of data, speeches, and other events.
In contrast, I highlight a smaller group of events. My theme is an expert guess about what we will be watching on TV and reading in the mainstream media. It is a focus on what I think is important for my trading and client portfolios.
This is unlike my other articles, where I develop a focused, logical argument with supporting data on a single theme. Here I am simply sharing my conclusions. Sometimes these are topics that I have already written about, and others are on my agenda. I am putting the news in context.
Readers often disagree with my conclusions. Do not be bashful. Join in and comment about what we should expect in the days ahead. This weekly piece emphasizes my opinions about what is really important and how to put the news in context. I have had great success with my approach, but feel free to disagree. That is what makes a market!
Last Week's Data
Each week I break down events into good and bad. Often there is "ugly" and on rare occasion something really good. My working definition of "good" has two components:
- The news is market-friendly. Our personal policy preferences are not relevant for this test. And especially -- no politics.
- It is better than expectations.
This was a generally positive week, both for data and for earnings.
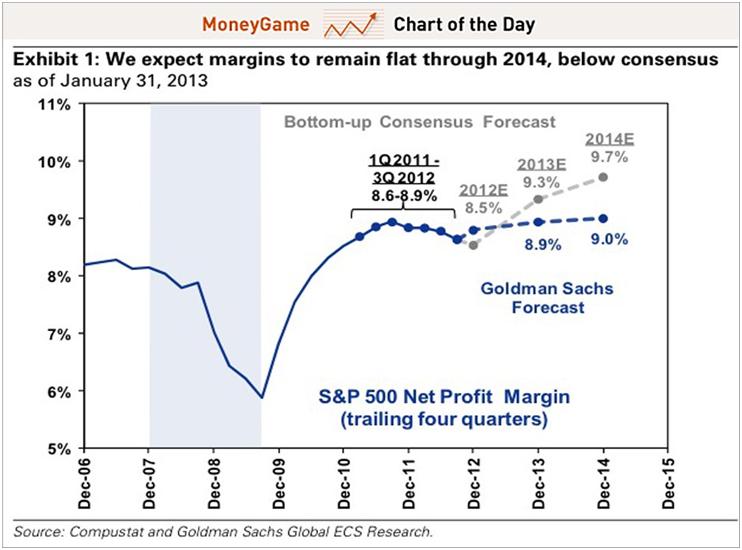
- The outlook for profit margins is promising in the eyes of most analysts. Sam Ro of Business Insider show the consensus take and highlights the dissent from Goldman Sachs. Even that viewpoint is better than the common bearish assumptions of rapid mean reversion. Here is the key chart:
- Nouriel Roubini is "optimistic" on stocks. (via John Sullivan at AdvisorOne). We always admire those who use facts, changing forecasts as indicated. For those who will call this a contrary indicator, you need a reality check. That interpretation guarantees that you will never change your mind.
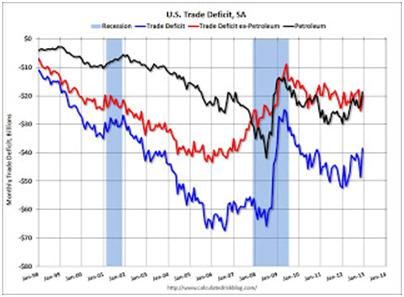
- The trade deficit improved – a lot! This certainly flips the sign on the preliminary Q412 GDP report, and may represent an increase of as much as 0.7% Contrary opinion from Steven Hansen. Here is a helpful chart from Calculated Risk:
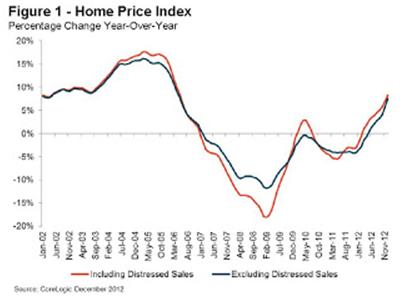
- Home prices are up 8.3% year-over-year. The CoreLogic data is reported by everyone's go-to source on housing, Calculated Risk.
- The earnings beat rate is still strong. Revenues, too. Despite the twist you might have seen from your favorite conspiracy site, Bespoke has the real story, with the expected great charts:
So far this earnings season, 64% of US companies that have reported earnings have beaten earnings estimates, while 63% of companies have beaten revenue estimates. As we highlighted last Friday, both of these readings are strong compared to past quarters over the last few years.
The Bad
There was some bad news, but not so much on economic data. Feel free to add in the comments anything you think I missed!
- Insiders are selling – big time! Mark Hulbert says that the pace is the fastest in several years. Cam Hui emphasizes the warning, pointing out that potential tax selling is no longer an excuse. Guy Ortmann of Scarsdale Equities also hit this theme in his excellent daily commentary. "…(T)he sentiment indicators are flashing very red warning lights as follows. The Rydex Ratio (contrary indicator) is now at a 10 year high of 48.8 showing the leveraged ETF traders as more bullish than at any point in the last decade. We would note that at the market lows in mid-November they were at a bearish extreme not seen since February 2009. Sell low, buy high??
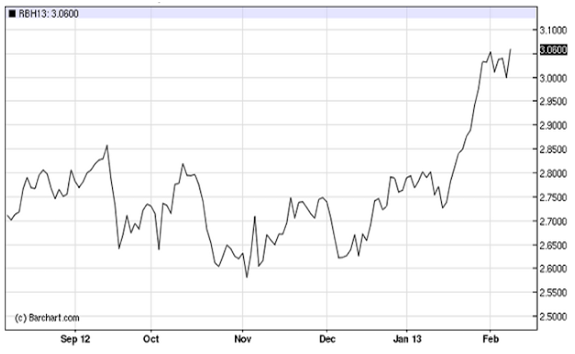
- Gas prices are up. It is the biggest share of pre-tax income in decades, about 4%. (via The Hill's Energy Blog). Sober Look sees a possible effect on consumer sentiment and spending and provides this chart of the front-month futures:
- Factory orders were a little light.
- Productivity is lower, implying slower growth. (Via Scott Grannis). Alternate view from Steven Hansen of GEI.
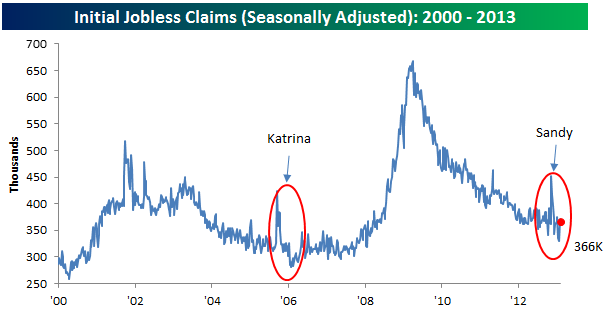
- Initial jobless claims moved higher. So much for the 300K range. Bespoke has a good chart with helpful notes:
The Ugly
The Wall Street Journal reporters have been urged to do shorter and funnier articles. I know the feeling! Mrs. OldProf, looking up from her book, just asked me about the length and humor quotient of today's piece. I admitted that it was long and laden with lessons about Ben Franklin, compromise, and what really will matter to our investments.
She recommended that I find something to spice it up a bit. The big-time bloggers all write about cars and music and such. Good advice! We all know that on Wall Street if you want a friend you should get a dog. Here is her suggestion for your next dog. It brought a smile to my face.
Recommended Reading
Abnormal Returns points to the Credit Suisse Global Investment Returns Yearbook. Tadas starts with an intriguing chart. The Yearbook explains that one and more. This is worth some time to study.
The Indicator Snapshot
It is important to keep the current news in perspective. My weekly snapshot includes the most important summary indicators:
- The St. Louis Financial Stress Index.
- The key measures from our "Felix" ETF model.
- An updated analysis of recession probability.
The SLFSI reports with a one-week lag. This means that the reported values do not include last week's market action. The SLFSI has moved a lot lower, and is now out of the trigger range of my pre-determined risk alarm. This is an excellent tool for managing risk objectively, and it has suggested the need for more caution. Before implementing this indicator our team did extensive research, discovering a "warning range" that deserves respect. We identified a reading of 1.1 or higher as a place to consider reducing positions.
The SLFSI is not a market-timing tool, since it does not attempt to predict how people will interpret events. It uses data, mostly from credit markets, to reach an objective risk assessment. The biggest profits come from going all-in when risk is high on this indicator, but so do the biggest losses.
The C-Score is a weekly interpretation of the best recession indicator I found, Bob Dieli's "aggregate spread." I have now added a series of videos, where Dr. Dieli explains the rationale for his indicator and how it applied in each recession since the 50's. I have organized this so that you can pick a particular recession and see the discussion for that case. Those who are skeptics about the method should start by reviewing the video for that recession. Anyone who spends some time with this will learn a great deal about the history of recessions from a veteran observer.
I have promised another installment on how I use Bob's information to improve investing. I hope to have that soon. Anyone watching the videos will quickly learn that the aggregate spread (and the C Score) provides an early warning. Bob also has a collection of coincident indicators and is always questioning his own methods.
I also feature RecessionAlert, which combines a variety of different methods, including the ECRI, in developing a Super Index. They offer a free sample report. Anyone following them over the last year would have had useful and profitable guidance on the economy. RecessionAlert has developed a comprehensive package of economic forecasting and market indicators. I will try to do a more complete review soon. Dwaine Van Vuuren also has an excellent data update, demonstrating how the coincident data have reduced recession prospects.
Doug Short has excellent continuing coverage of the ECRI recession prediction, now well over a year old. Doug updates all of the official indicators used by the NBER and also has a helpful list of articles about recession forecasting. His latest comment points out that the public data series has not been helpful or consistent with the announced ECRI posture. Doug also continues to refresh the best chart update of the major indicators used by the NBER in recession dating. He also provides this helpful chart of the ECRI's public indicator: 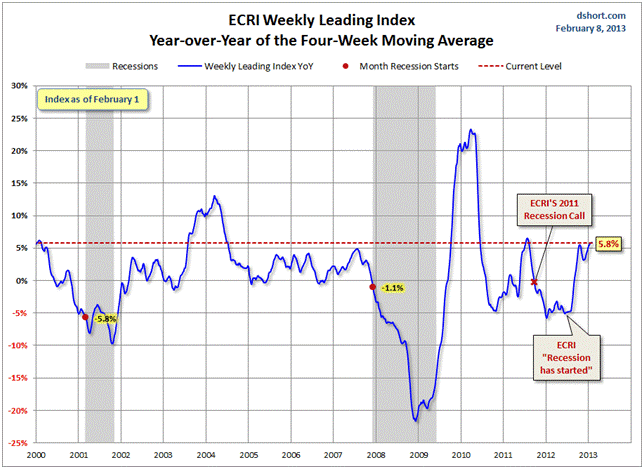
The average investor has lost track of this long ago, and that is unfortunate. The original ECRI claim and the supporting public data were expensive for many. The reason that I track this weekly is that it is important for corporate earnings and for stock prices. It has been worth the effort for me, and for anyone reading each week.
Readers might also want to review my Recession Resource Page, which explains many of the concepts people get wrong. 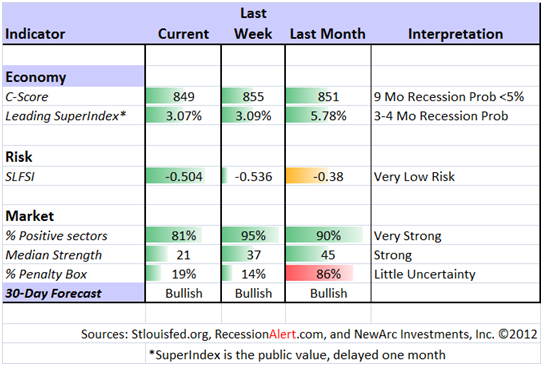
Our "Felix" model is the basis for our "official" vote in the weekly Ticker Sense Blogger Sentiment Poll. We have a long public record for these positions. About a month ago we switched to a bullish position. These are one-month forecasts for the poll, but Felix has a three-week horizon. Felix's ratings stabilized at a low level and improved significantly over the last few weeks. The penalty box percentage measures our confidence in the forecast. The low current rating means that few ETFs are in the penalty box, so we have more confidence in the overall ratings.
[For more on the penalty box see this article. For more on the system ratings, you can write to etf at newarc dot com for our free report package or to be added to the (free) weekly ETF email list. You can also write personally to me with questions or comments, and I'll do my best to answer.]
The Week Ahead
This week is extremely light on economic data.
The "A List" includes the following:
- Michigan Consumer Sentiment (F). More important than usual because of the recent dip, fuel prices, and the payroll tax increase.
- Initial jobless claims (Th). Employment will continue as the focal point in evaluating the economy, and this is the most responsive indicator.
The "B List" includes the following:
- Retail Sales (W). Holiday season is significant. Confirmation of same-store sales?
- JOLTs Report (T). No one seems to do a really good job with this, since they try to infer overall employment. It is more about structure.
- Industrial Production (F). This is an element of GDP, so it will be watched closely.
The State of the Union on Tuesday night will be the big story of the week.
There will be Fed speeches almost every day. These are not really relevant given the Fed guidance, but that will not stop the pundits.
Earnings stories are winding down, but still noteworthy.
Trading Time Frame
Felix has continued a bullish posture. Felix did pretty well last year, becoming more aggressive in a timely fashion, near the start of the summer rally, and getting out a couple of months ago. Since we only require three buyable sectors, the trading accounts look for the "bull market somewhere" even when the overall picture is neutral. Felix has been cautious, but still has caught most of the rally, and done so with less risk. Felix has been bullish in 2013, but the ratings have been declining a little.
Investor Time Frame
Each week I think about the market from the perspective of different participants. The right move often depends upon your time frame and risk tolerance.
The current investment climate offers a dearth of choices!
Prof. James Hamilton has a great post explaining your choices: "The question is maybe not what is a good investment right now, but instead what is the least bad investment." He writes further as follows:
But what else are you going to do? Low as the dividend yield is on stocks at the moment (2.04%) , it's still better than what you can get on a 10-year U.S. Treasury bond. Moreover, any inflation in the prices of the goods and services that firms sell, as well as any profit gains associated with a larger market, should boost those dividends over time, whereas inflation would continue to erode what you make on the Treasury. Or you might look at a Treasury Inflation Protected Security, whose coupon will rise with the headline CPI. That's currently yielding a hefty -0.57%. Anybody want to sign up for that 10-year plan?
High-yield bonds are dangerous, partly because of the stampede for yield. (Formerly referred to in my series merely as the Quest for Yield). David Schawel (in an article highlighted for us all by Abnormal Returns), writes as follows:
Greater price risk now exists: The devil is always in the details, and price is an important risk that most corporate bond investors, in my opinion, are overlooking.
Gold is currently on a "sell signal" according to Georg Vrba, whose technical model follows the Coppock indicator.
The last sell signal was at the end of November 2012 and no new buy signal has so far appeared. What is needed now for an early buy signal is a sustained upward move of the gold price to over $1,700 during the next few weeks, something which is certainly not outside the bounds of probability.
Meanwhile, we have continuing "headline risk." Buying stocks in times of fear is easy to say, but so difficult to implement. The big-shot experts on TV are calling you the dumb money, even when you have been right! (in case you missed it, see this discussion).
Almost everyone I talk with wants to out-guess the market. The problem? Value is more readily determined than price! Individual investors too frequently try to imitate traders, guessing whether to be "all in" or "all out."
There are some alternatives, but the answer is different for each investor. We have collected some of our recent recommendations in a new investor resource page -- a starting point for the long-term investor. (Comments and suggestions welcome. I am trying to be helpful and I love feedback).
Final Thought
Is there realistic hope for a budget compromise?
Most of the pundits you see or read have little understanding of history, Congress, or the policy-making process. For them the answers are easy and obvious. Anyone who does not agree is a fool.
I am currently spending my leisure time reading Walter Isaacson's wonderful biography of Ben Franklin. As I read the final chapters on the Constitutional Convention I am struck by two themes related to compromise:
- The U.S. Constitution required serious compromise of strongly-held principles by all parties. Franklin was not a great orator, but his final speech to the convention is widely acclaimed as stimulating the needed support for this new government.
- The resulting government implemented checks and balances that would make compromise the order of the day for progress.
If you do not understand this, you will never be able to see how government decisions affect your investments.
Senate Democrats are vague but hopeful in their comments. Obama has earlier stated that the sequestration cuts would not occur. I will be closely watching Tuesday's speech for signs of flexibility and bi-partisanship.
Investment Conclusion
I anticipate plenty of SOTU discussion on Wednesday. The challenge will be to sift through the partisan commentary.
Avoiding sequestration would be bullish for the overall market. My guess – and that is all that anyone can do right now – is that observers see this as a 50-50 proposition or worse.
Specific sectors that would be helped relate primarily to defense stocks, a group that I'll be watching closely. (Northrup Grumman (NOC), Lockheed Martin (LMT), and Raytheon (RTN), are candidates).
Disclosure: Currently long hedged positions in NOC and RTN for some accounts.
