
It's time again for my weekly gasoline update based on data from the Energy Information Administration (EIA). Rounded to the penny, the average for Regular was down five cents and Premium three cents. Since their interim high in late February, Regular is down 21 cents and Premium 20 cents.
According to GasBuddy.com, three states (Hawaii, California and Alaska) are averaging above $4.00 per gallon. One state (Illinois) is in the 3.90-4.00 range.
How far are we from the interim high prices of 2011 and the all-time highs of 2008? Here's a visual answer.
The next chart is a weekly chart overlay of West Texas Intermediate Crude, Brent Crude and unleaded gasoline end-of-day spot prices (GASO). WTIC closed today at 95.18, down 2.70 from last Monday.
The volatility in crude oil and gasoline prices has been clearly reflected in recent years in both the Consumer Price Index (CPI) and Personal Consumption Expenditures (PCE). For additional perspective on how energy prices are factored into the CPI, see What Inflation Means to You: Inside the Consumer Price Index. 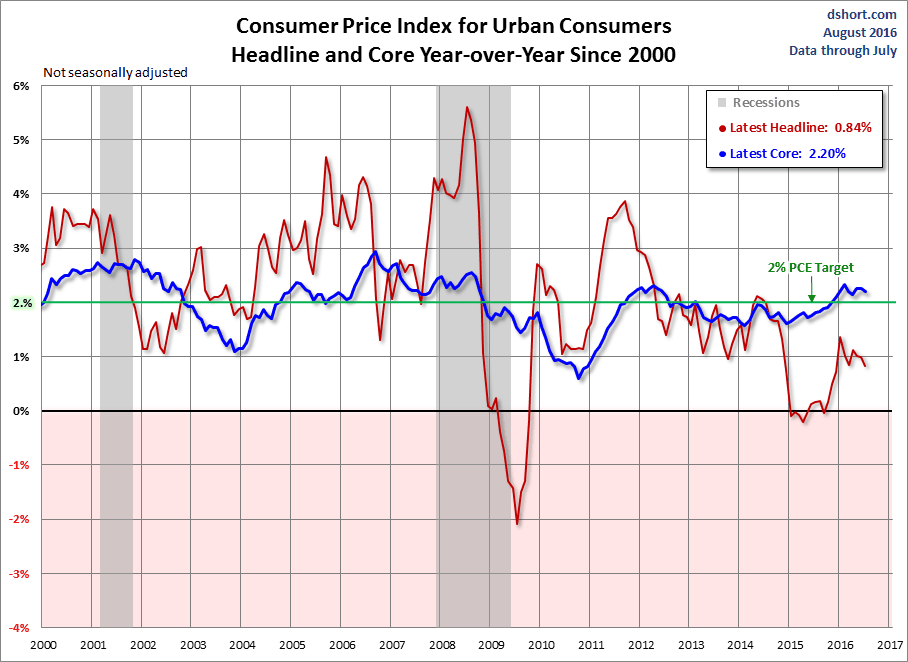
The chart below offers a comparison of the broader aggregate category of energy inflation since 2000, based on categories within Consumer Price Index (commentary here). 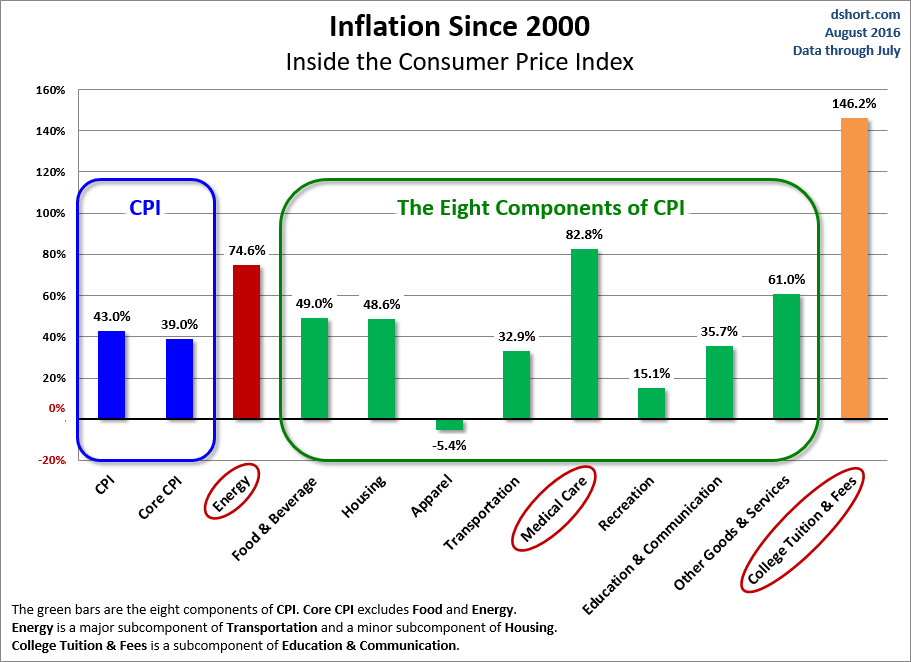
Here are some additional commentaries related to gasoline prices:
- English (UK)
- English (India)
- English (Canada)
- English (Australia)
- English (South Africa)
- English (Philippines)
- English (Nigeria)
- Deutsch
- Español (España)
- Español (México)
- Français
- Italiano
- Nederlands
- Português (Portugal)
- Polski
- Português (Brasil)
- Русский
- Türkçe
- العربية
- Ελληνικά
- Svenska
- Suomi
- עברית
- 日本語
- 한국어
- 简体中文
- 繁體中文
- Bahasa Indonesia
- Bahasa Melayu
- ไทย
- Tiếng Việt
- हिंदी
Weekly Gasoline Update: Prices Continue To Fall
Published 06/25/2013, 01:15 AM
Updated 07/09/2023, 06:31 AM
Weekly Gasoline Update: Prices Continue To Fall
Latest comments
Install Our App
Risk Disclosure: Trading in financial instruments and/or cryptocurrencies involves high risks including the risk of losing some, or all, of your investment amount, and may not be suitable for all investors. Prices of cryptocurrencies are extremely volatile and may be affected by external factors such as financial, regulatory or political events. Trading on margin increases the financial risks.
Before deciding to trade in financial instrument or cryptocurrencies you should be fully informed of the risks and costs associated with trading the financial markets, carefully consider your investment objectives, level of experience, and risk appetite, and seek professional advice where needed.
Fusion Media would like to remind you that the data contained in this website is not necessarily real-time nor accurate. The data and prices on the website are not necessarily provided by any market or exchange, but may be provided by market makers, and so prices may not be accurate and may differ from the actual price at any given market, meaning prices are indicative and not appropriate for trading purposes. Fusion Media and any provider of the data contained in this website will not accept liability for any loss or damage as a result of your trading, or your reliance on the information contained within this website.
It is prohibited to use, store, reproduce, display, modify, transmit or distribute the data contained in this website without the explicit prior written permission of Fusion Media and/or the data provider. All intellectual property rights are reserved by the providers and/or the exchange providing the data contained in this website.
Fusion Media may be compensated by the advertisers that appear on the website, based on your interaction with the advertisements or advertisers.
© 2007-2024 - Fusion Media Limited. All Rights Reserved.