US Dollar Fundamental Analysis:
The US dollar enjoyed a major broad rally in the beginning of the week after which it corrected lower as a result of the weaker than forecasted inflation and retail sales reports.
The positive note is that inflation was only marginally weaker than forecasted and it still printed a healthy 2.2% y/y.
Further, the retail sales report is known to be highly volatile thus it seems unlikely that the Fed will be dissuaded from these reports to raise rates in June.
This week the Empire state manufacturing and Philly Fed manufacturing indexes will be reported as well as housing starts and building permits.
Taking all into account, only a substantially weaker than expected prints this week could change the outlook on future Fed rate hikes and with that, the US dollar should remain supported on its uptrend.
EUR/USD:
Fundamentals
During the first part of last week, EUR/USD retraced down, most likely on profit taking after Macron won the French election and became the next President of France. Then in the middle and toward the end of the week, the pair bottomed out as data showed further enhancements in the recovery of the Eurozone economy thus strengthening the case for a sooner rather than later ECB tightening.
This week there are more reports in line to be published including the flash GDP, the German ZEW index, and final CPI numbers. Unless these reports miss forecasts big time, the euro should remain broadly supported while EUR/USD is likely to stay largely range-bound amid a strong euro and a strong USD.
Technicals
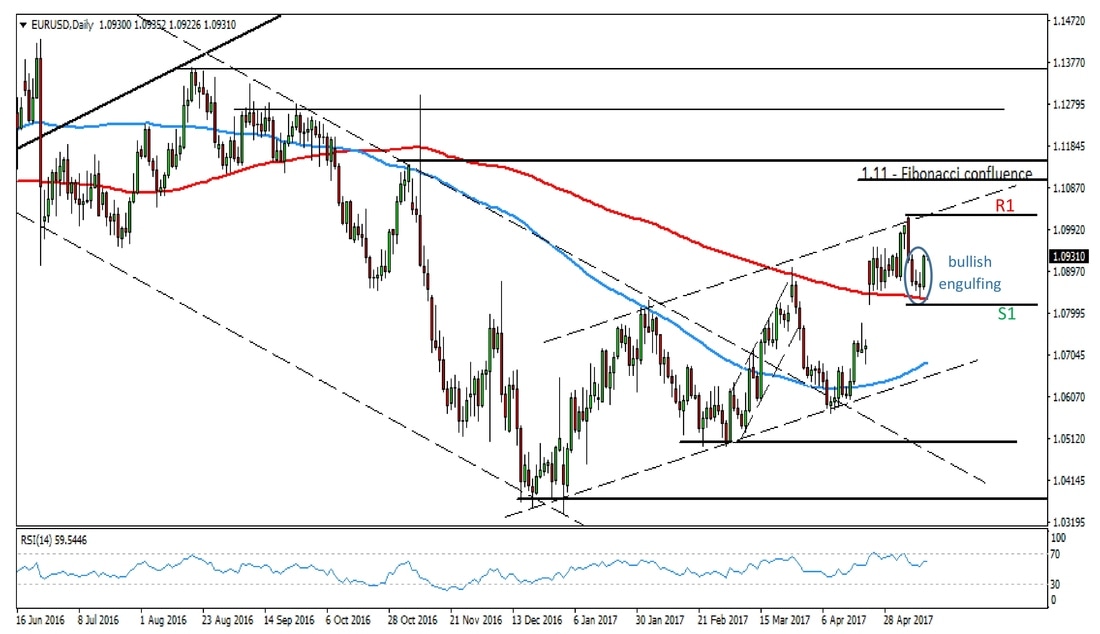
The pair has reversed near term at the 200-day moving average (red line) around the 1.0850 support area (S1) by forming a bullish engulfing candlestick pattern. Given the firmness of the support area, the momentum of the bullish engulfing pattern and the strength of the previous uptrend, EUR/USD looks headed toward the previous highs at 1.1000 – 1.1020 (R1).
The 1.1050 area (resistance border of the channel) and the 1.1100 Fibonacci zone are the next resistance levels to watch higher. 1.0750 is support further to the downside.
EUR/USD Daily chart - Likely headed for resistance again.
GBP/USD:
Fundamentals
The main event of last week, the bank of England meeting proved to be very negative for the value of the pound as the bank was more dovish than expected. Governor Mark Carney said that the recently higher inflation is likely to be temporary and he also talked about the risks that lie ahead for the economy. Further, there was only one member of the MPC voting for a rate hike, which was expected.
So, taking everything into account some correction in the near term is likely for the pound and the GBP/USD pair. In the longer term, however, GBP/USD is still likely to strengthen and conquer the 1.30 handle.
Much will depend on this week’s economic data from the UK which could send the pound either way. Inflation data will be released first on Tuesday, followed by employment and earnings on Wednesday and finally ending with retail sales on Thursday. If these reports come in below expectations they will extend the downtrend from last week in GBP/USD.
Technicals
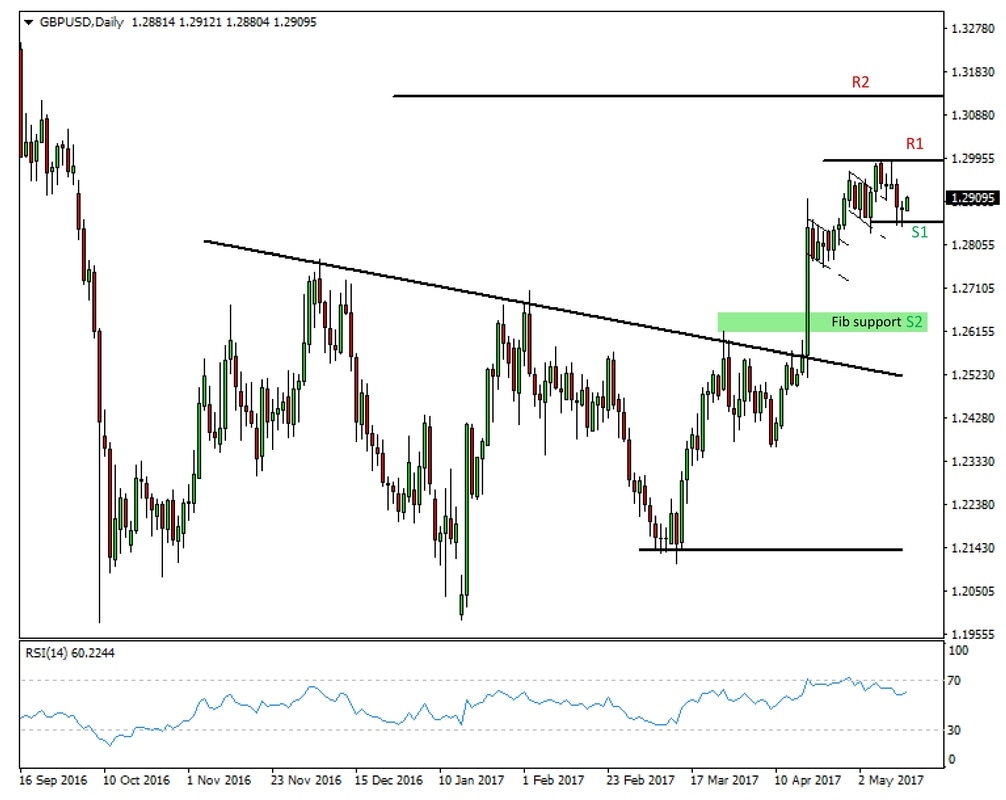
Overbought readings on the RSI has declined after last week’s retracement in GBP/USD. Still, there seems to be further downside scope for the pair given the length of the previous uptrend and the resistance at 1.30 (R1) that the market was unable to capture.
1.2850 (S1) was established as firm support after the pair bottomed here last week. If this level is broken to the downside then it’s highly probable that GBP/USD will reach the 1.2600 – 1.2650 area (S2) which is a Fibonacci confluence support aided by previous highs’ former resistance now support.
Above 1.30, 1.3120 is resistance.
GBP/USD Daily chart – Further retracement looks likely.
USD/JPY:
Fundamentals
USD/JPY traded higher in the beginning of the week on risk appetite after Macron won the election. Then a North Korean official saying that North Korea is prepared to turn any US treat into ashes USD/JPY fell on risk aversion and further extended the decline after the weak US inflation and retail sales reports on Friday.
This week, several economic reports will be released from Japan including producers inflation (PPI), industrial production and GDP. Still, USD/JPY is most likely to trade mainly on the risk on/off barometer and the US economic data. With the Volatility VIX index at multi-decade lows and the US S&P 500 index at all time highs, USD/JPY seems likely to extend the rally toward the 115 area.
Technicals
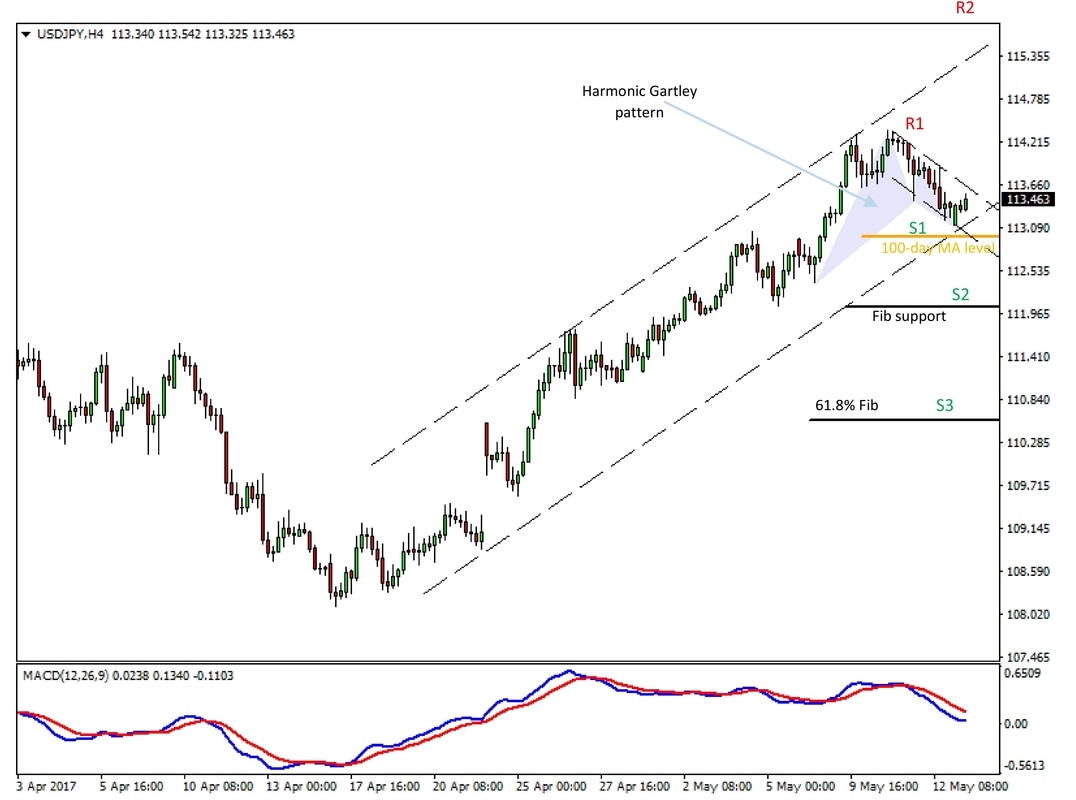
USD/JPY hit the 113.00 – 113.20 support area we discussed last week (orange) by forming a harmonic Gartley pattern. The pair is still trading inside of the retracement channel and when it breaks it, the move is likely to accelerate higher first toward the highs of 114.40 (R1), and then toward the 115.00 – 115.50 resistance area on the daily chart and resistance trendline of the channel shown on the chart (R2).
If on the other hand, the pair continues to move down, below 113.00, a confluence of Fibonacci retracements at 112.00 is the next support zone (S2).
USD/JPY 4h chart - The retracement has hit support.
