US dollar Fundamental Outlook: GDP and PCE in focus on a light calendar:
After ultra-quiet trading last week, the calendar gets somewhat busier this week with the Final GDP, Consumer Confidence and PCE Index scheduled for release. Additionally, Fed Chair Yellen and several other FOMC Presidents will be speaking, and hopefully, the US dollar will be able to finally pick a direction.
The currency is directionless after the June 14 Fed meeting where the central bank projected one more rate hike till the end of the year. It is now up to economic data to justify such a move and if the US economy slows down further then the US dollar will have more room to fall broadly against the major currencies.
Euro Fundamental Outlook: Pivotal CPI release on Friday:
Friday’s PMI reports were generally positive showing more strength in the manufacturing sector over services. Investors continue to be bullish on the euro and thus EUR/USD is likely to struggle falling lower and even if it does, it is bound to be short lived.
The pivotal CPI flash report on Friday will be in focus for the euro this week. Estimates stand at 1.3% and 1% for the nominal and core numbers respectively.
Depending on the actual numbers the euro could either fall on a lower number or rally on stronger than expected figures.
EUR/USD Technical Outlook:
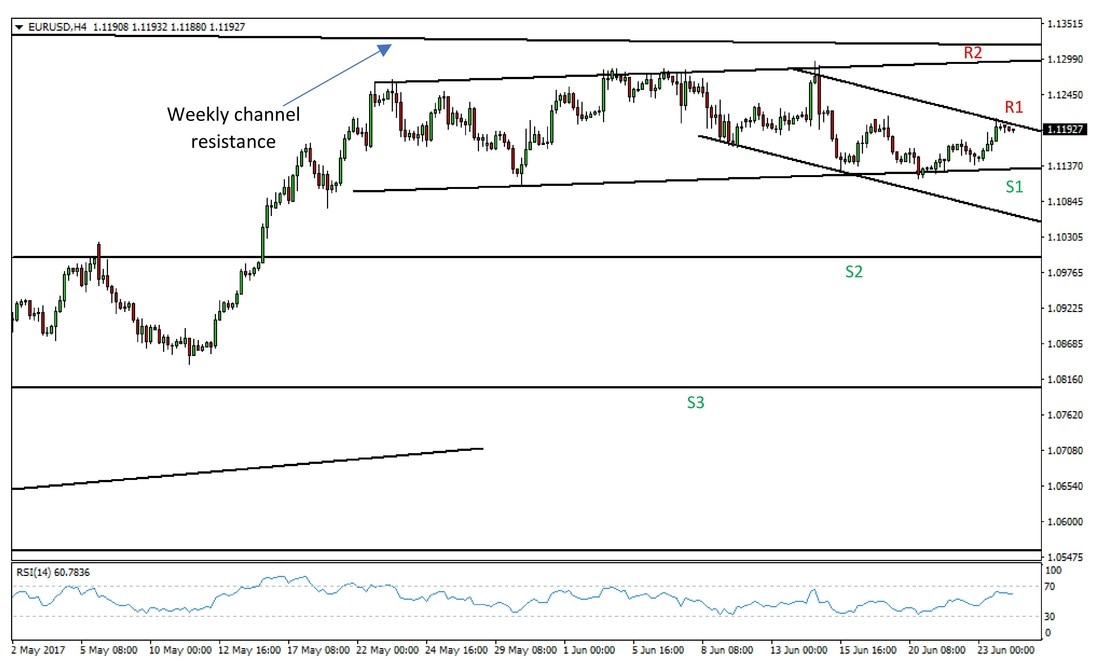
The pair is still trading inside of the channel that we showed two weeks ago. Whether it breaks out to the downside, now depends on a new, falling channel (right side of the chart). The price is now at the resistance trendline of the falling channel at 1.12 (R1) and if it’s rejected there then another retest of 1.11 (S1) should be the next stop for EUR/USD going lower.
In this scenario, if then 1.11 is broken to the downside, that will open the way to the 1.10 support area (S2).
On the other hand, a break of 1.12 higher will likely mean that EUR/USD will test the top of the rising channel at around 1.13 (R2).
EUR/USD 4h chart - Which channel will be broken first?
British pound Fundamental Outlook: Uncertainty exerts downward pressure:
Sterling suffered to more upheavals last week as the division within the Bank of England appears to be growing rather than shrinking. On the political front, things don’t look nice either. Theresa May failed to form a coalition government last week as Northern Ireland’s Democratic Unionist Party came up with more demands.
The Bank of England will release the BOE Financial Stability Report on Tuesday and Governor Mark Carney will hold about half an hour later. On the data side, the current account and final GDP will be released on Friday.
GBP/USD Technical Outlook:
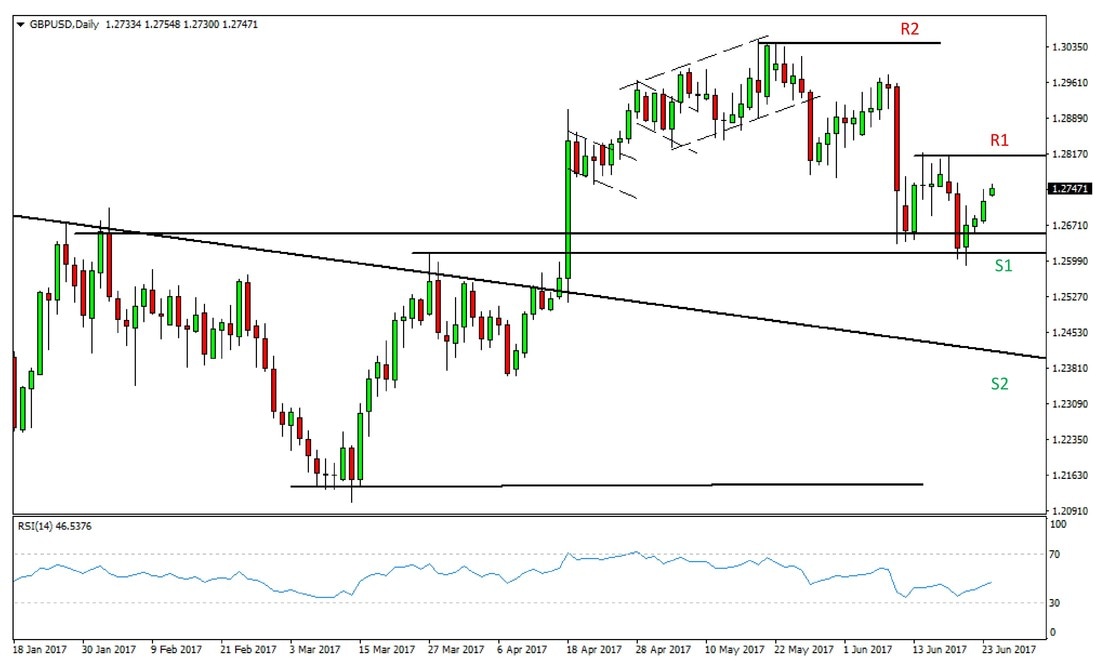
The pair remains stuck in the range between 1.26 (S1) and 1.28 (R1). Although it broke below 1.26 last week, it failed to close below the key level and thus the range largely remains intact.
Note, however, there was no strong rejection from below the 1.26 level and that suggests a bottom is far from confirmed for the pair. In fact, the recent 3 downswings look steeper and sharper than each of the subsequent rallies, which in a way uncovers the downward pressure that GBP/USD is feeling.
A momentum breakout of the range in either direction is needed for the pair to pick a direction on the daily chart. In the meantime, looking for opportunities on intra-day charts seems like the better idea.

GBP/USD Daily Chart - Still range-bound
Japanese yen Fundamental Outlook: CPI to show how Japan is doing on the inflation front:
BOJ Governor Kuroda on Wednesday and the CPI reports on Thursday are the main events for the Japanese currency this week. Still, no major surprises are expected and the risks are slightly tilted to the downside for the CPI release.
Coupled with a determinedly dovish Bank of Japan and a hawkish Fed, USD/JPY should slowly grind higher on the back of slowly rising US yields.
The risks to any bearish-yen scenario are, of course, unexpected geopolitical shocks that may trigger a risk-off move in markets. Geopolitical tensions are significantly increased today compared to even a few years ago and that should always be borne in mind when trading the yen and the USD/JPY pair.
USD/JPY Technical Outlook:
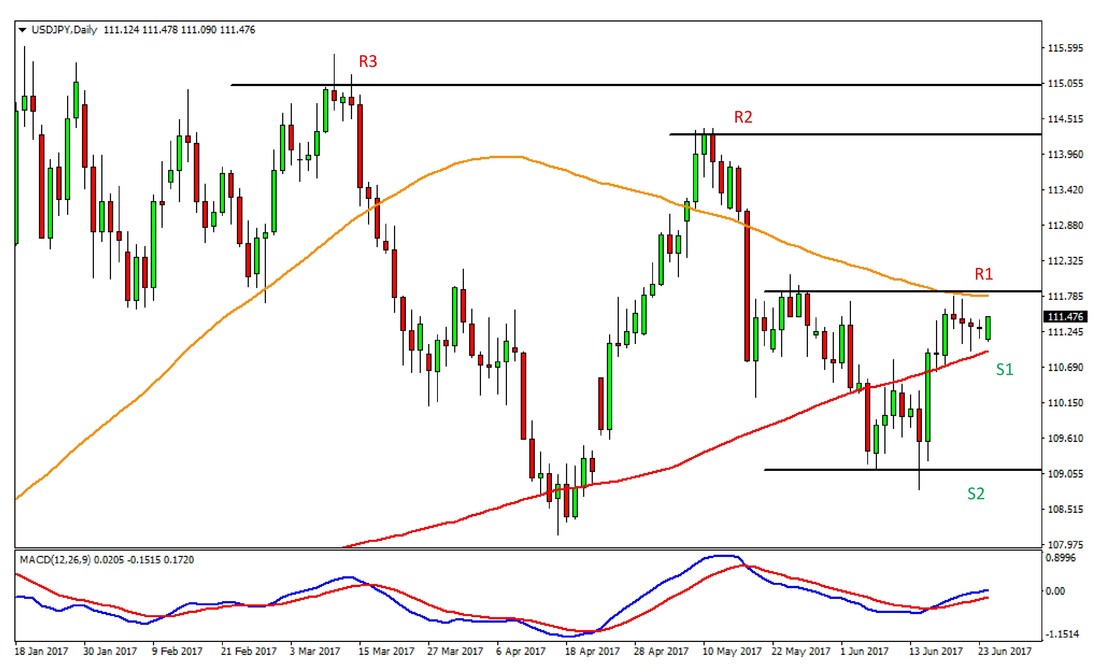
USD/JPY is also range-bound as the whole market is in a low-volatility, wait and see mode. The MACD indicator continues to show a bullish trend but the price remains stuck between the 100-day (Orange) and 200-day (Red) moving averages.
The 111.80 – 112.00 area, close to the 100-day MA is strong near-term resistance (R1). A close above it opens the way to 114.00 (R2) and maybe 115.00 (R3).
In contrast, a close below the 200-day MA at 110.90 (S1) will likely mean a drop below 110.00 and a retest of the lows at 109 (S2).


