
Market Overview
The Emini weekly chart has had 8 consecutive bull bars. Because that is rare, it is climactic. The odds favor a 2 – 3 week pullback beginning within a couple weeks.
Crude oil has rallied strongly for 8 weeks. It is in search of a top of what will probably be a trading range for many months. The range will likely be between 40 and 65.
The EUR/USD weekly Forex chart has been in a trading range for 4 months. The bulls have bought every new low since the bear channel began in June. Therefore, the downside from here is probably limited.
Crude oil Futures market: Strong outside up week in developing trading range

By trading below last week’s low, this week triggered a sell signal on the weekly chart. But, the week then rallied to above last week’s high. That stopped out most of the bears. In addition, this week is now an outside up week and a buy signal bar for next week.
A buy signal after a failed sell signal is good for the bulls. However, the 2 month rally is following a tight bear trend. The 1st reversal up typically leads to a trading range and not a bull trend. Therefore, this rally is searching for the top of the trading range. After such an extreme selloff, the developing trading range will probably last many months.
Although the 20 week EMA is resistance, especially after a 4 week tight trading range, this week is trying to start a new leg up. The 50% retracement is around the 60 Big Round Number. That is the next magnet above.
Legs in trading ranges often overshoot support and resistance
Legs in trading ranges usually overshoot support and resistance. Consequently, the top of the range will probably be closer to 65. However, this rally will likely not get there without first pulling back.
The December low is probably around the bottom of the range. When crude oil collapsed to 42 in December, it reversed up sharply. There will probably be buyers there again if the next leg down reaches that level.
Because the sell climax was extreme and crude oil will probably be sideways for many months, traders will buy low, sell high, and take quick profits. If a leg is strong, traders will wait for a 2nd signal before entering a reversal trade. For example, after 4 days up, the bears will typically want a double top or a micro double top before selling.
EURUSD weekly Forex chart: Strong selloff to bottom of 4 month trading range
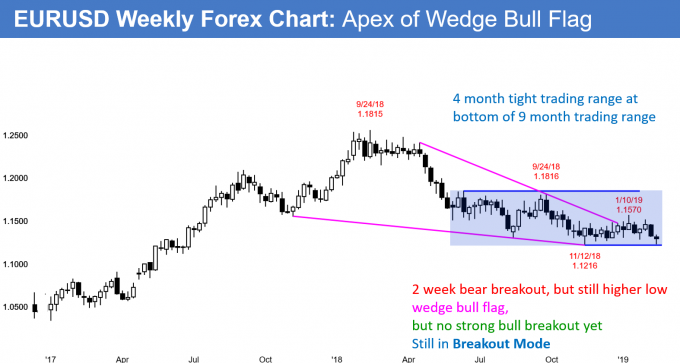
The EUR/USD weekly Forex chart has consecutive bear bars over the past 2 weeks. However, this week closed above its midpoint and above the January and December lows.
The bears need to do more before traders believe this breakout will succeed. For example, if there are consecutive big bear bars closing near their lows and below the November low, the breakout will probably continue down for at least a couple legs.
In addition, a reasonable target would be 1.09, which is a measured move down based on the height of the 4 month tight trading range. They do not have a strong breakout yet, so any new low will probably turn up from well above 1.09.
That range is within a 9 month trading range that is 600 pips tall. A measured move down from there is 1.06. That currently is unlikely because the weekly chart has been looking for a bottom for 9 months.
Bear leg in what will be a 600 pip tall trading range
The entire 2018 selloff is still around a 50% pullback from the 2017 rally. Therefore, the bulls will likely buy not far below the November low, just as they have been buying new lows since June.
This is a Stairs pattern. A bear trend in a Stairs pattern usually evolves into a trading range. The top of the range is often at the start of the bear channel. That is the June lower high around 1.1850.
A rally over the next several months would probably be a bull leg in the developing trading range and not a bull trend. It therefore would likely be relatively week. Consequently, the bulls would need many months before they could get back to 1.18.
Monthly S&P 500 Emini futures chart: Consecutive bull bars in yearlong trading range

The monthly S&P 500 Emini futures chart triggered a buy signal this month by going above January’s high. So far, February is a bull bar.
However, the Emini is also in the middle of a yearlong trading range. In addition, there have been several abrupt reversals over the past year. Consequently, traders on the monthly chart are hesitant to hold onto trades and are taking quick profits.
That reduces the chance that February is resuming the 2017 bull trend. More likely, the 2 month rally is a bull leg in the trading range. Furthermore, the trading range will probably continue for at least several more months.
Weekly S&P 500 Emini futures chart: Emini weekly chart has climactic streak of 8 bull bars

The weekly S&P 500 Emini futures chart formed its 8th consecutive bull trend bar this week. I could find only one instance in the 20+ year history of the Emini with a streak of more than 9 weeks. Therefore, the probability is high that either next week or the following week will have a bear body.
Even though the rally is unsustainable and therefore a buy climax, it is strongly bullish. The bulls have been happy to buy above the prior week’s low for 8 weeks. They will be eager to have an opportunity to buy below the prior week’s low. As a result, once there is a pullback, it will probably only last 2 – 3 weeks.
Possible gap up and blow-off top
With this past week closing on its high, there is an increased chance of a gap up next week. Many institutions have been taking profits over the past several weeks because of the extreme buy climax. Others have been shorting. If next week gaps up, the result could be panic buying from the bulls afraid of missing a strong breakout above the triple top and from bears covering their shorts.
However, the odds are that such a breakout would be a blow-off top. The weak bulls would have bought at the top of a buy climax, and the weak bears would have finally exited their losing shorts. Since both are desperate to buy, they will buy at any price, no matter how high. Once the weak bulls and bears have finally bought, who is left to buy? Probably no one.
Strong traders will be happy to sell to those desperate buyers, but only at a high price. The result often is a very sharp rally, and then the end of the bull trend for several weeks.
Profit taking creates a pullback
That creates a big bull breakout late in a bull trend. Strong bulls see it as an unusually great, but brief, opportunity to take profits, and they sell. Strong bears also believe it is a climactic end of the rally. They know that strong bulls will take profits, and not be buying. These strong bears therefore short.
The result of strong bulls selling out of their longs and strong bears selling to get short is a pullback. It will probably last at least a few weeks.
Daily S&P 500 Emini futures chart: Parabolic wedge rally

The daily S&P 500 Emini futures chart has rallied for 2 months in a tight bull channel. The momentum up is strong. It is trying to hold above the 200 day moving average (not shown). There is a magnet at the October-November-December triple top just above 2,800. Friday’s strong close increase the odds of higher prices next week. If next week gaps up, there could be enough panic buying to break above the triple top.
No pullback because too many traders want a pullback
How is it that a buy climax can continue up for such a long time? Think about what is going on. Do you want to buy a pullback? Yes, and the reason is that you believe any pullback will come back to the top of this rally, which means you will not lose money.
That is a very high probability bet. High probability bets always have bad risk/reward. For bulls buying up here, their stop has to be below the December low because a pullback could be very deep. Consequently, the risk is great. Furthermore, the chart has been in a trading range for a year so the remaining reward is small.
Continued bull trend or start of trading range
A bull buying here is betting that one of two things will happen. He believe that the bull trend will continue or it will evolve into a trading range. He is betting against a bear trend because it is currently a low probability bet.
If the bull trend continues, the bull can exit with a profit. If the trend becomes a trading range, he knows that the odds are high that a bull leg will follow any bear leg. This is true even if a selloff retraces 90% of the rally. If he buys more lower, the odds are that there will be a higher low. The rally from that low will probably test the top of the current leg up. As a result, he can get out with a profit on his lower buy and breakeven on his 1st buy.
Parabolic wedge buy climax
It is important to note that the past 5 weeks have had 3 legs up in the tight bull channel. That is a parabolic wedge buy climax. Wednesday was a sell signal bar. But when a bull channel is tight, many bulls want a 2nd sell signal or a micro double top. Therefore, next week will probably go above this week’s high before a pullback begins.
Once there is a reversal down from a buy climax, the bulls typically wait for at least a couple legs down before buying again. That usually takes at least 10 bars, which means 2 weeks.
Also, when there is a reversal down from a wedge, there are magnets at the 2 higher lows in the wedge. The nearer one is the February 8 low of 2680.75. If the Emini gets there, it will probably stall for a few days. Traders will decide if the pullback has ended or if it will continue down to the start of the wedge rally. That is the January 23 low of 2612.50. If so, the selloff might take more than a month to get there.