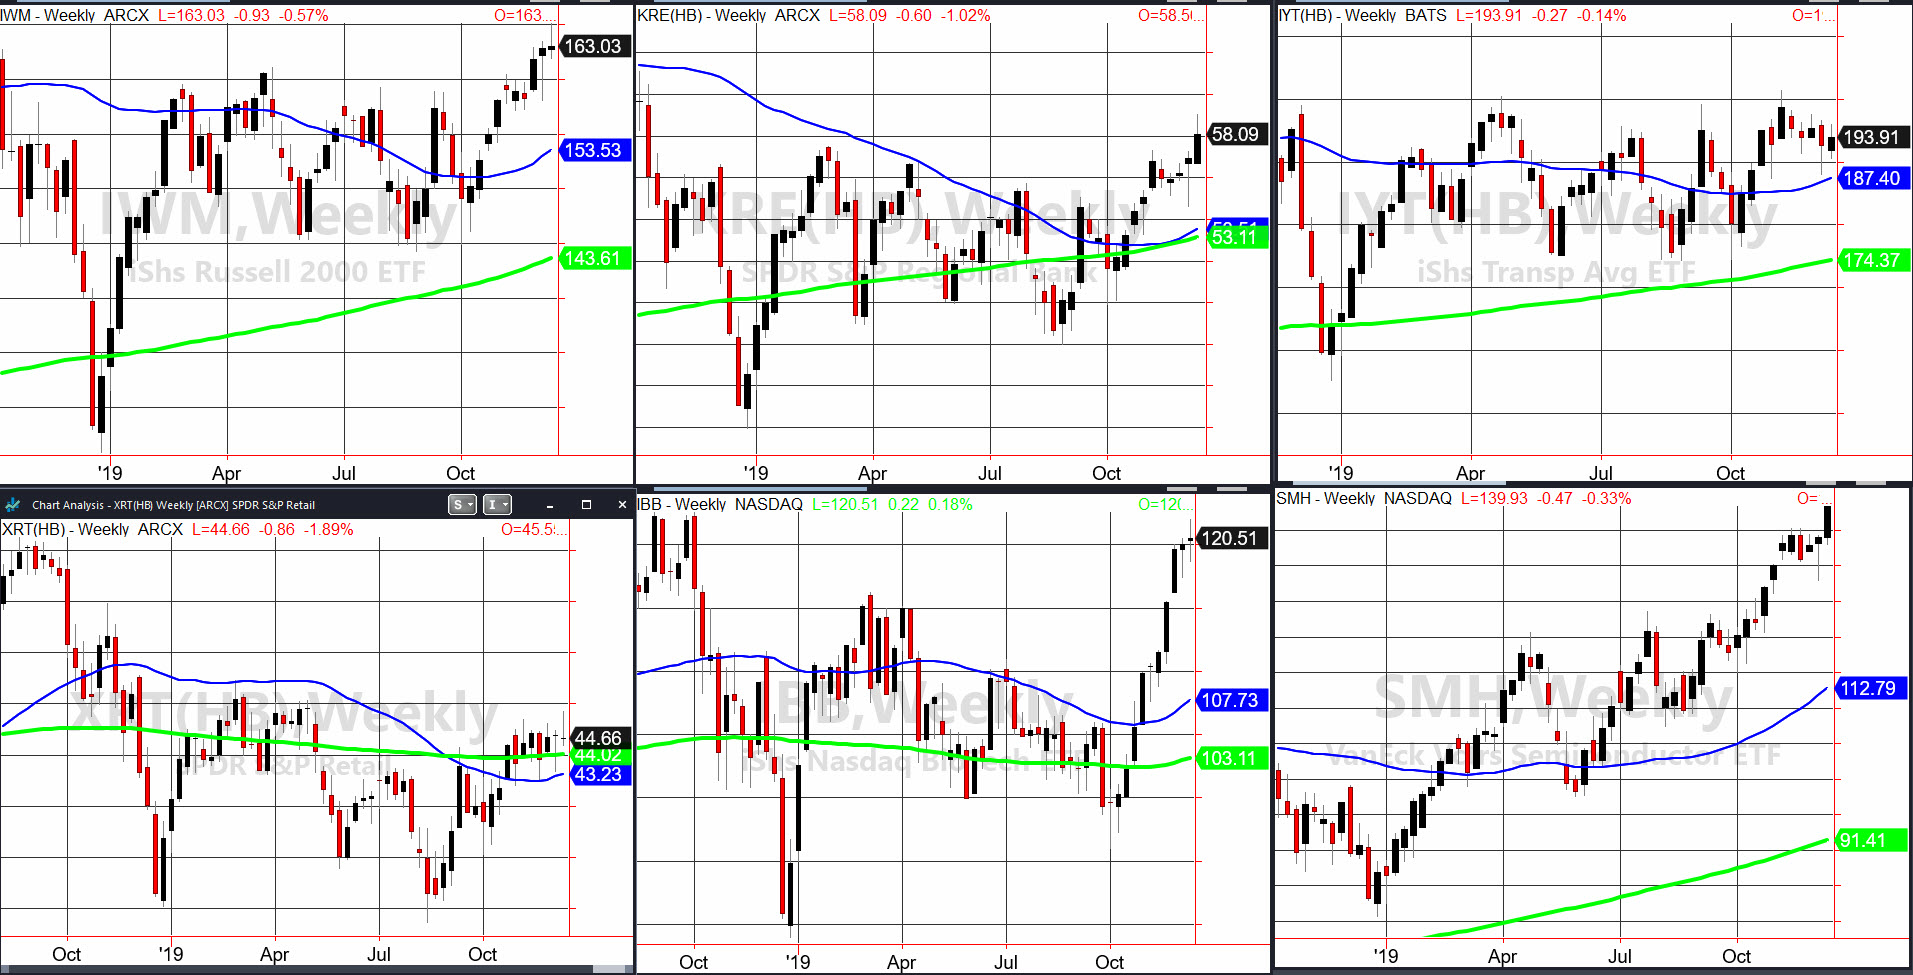
After a week of back and forth headlines, all seemingly ended well for the Economic Modern Family.
Oh sure, they still seriously underperform the big guns S&P 500, Nasdaq 100 and the Dow.
And within the Family itself, Sister Semiconductors SMH keeps thumbing her nose at the rest of her clan, especially at Granny Retail XRT.
Two big news items came out on Friday-one, the victory of Boris Johnson, which could mean an official move by Britain to exit the EU.
Secondly, the Phase One deal that Trump and China are “aiming” to sign.
Of course, this deal comes with the usual caveat, “it would still be wise to be skeptical of whether China would deliver on certain agreements.” Lighthizer

Of course, we look to the Economic Modern Family’s weekly charts for answers.
To review, the “inside” of the market is the best measure for the true economic picture, regardless of economic stats, trade news, geopolitical turmoil and the like.
Most, not all, had a great week.
The Russell 2000 IWM was one that had a good week. Am I concerned it ultimately closed only slightly higher week to week in price, while the SPY, QQQ and DIA made new all-time highs?
Yeah, I am. However, concern is not anything more than that-concern
Regional Banks KRE also had a great week. It cleared the 2019 highs to make a new one.
Transportation IYT had an inside week. Another concern. Once again, big eyes here for the coming week to break the range one way or another.
Granny Retail XRT continues to be a concern, especially seasonally. While XRT tried to clear the most recent highs, with a weak retail sales report, instead XRT closed lower from a week ago.
Biotechnology IBB reflects investor appetite for risk. Noteworthy though, is that it matched the highs from October 2018 right before the crash. Bulls definitely wants to see those levels clear.
Then there’s our sister SMH. Highly visible, she is the best case for more upside, provided the rest of the Family hangs in there.
S&P 500 (SPY) 313.60 or the 10 DMA support. 318.67 new all-time high.
Russell 2000 (IWM) 163.41 pivotal area failed-still $9.00 away from the ATH. Support at 162 to hold
Dow (DIA) 279.20 the support with a new ATH at 283.61
Nasdaq (QQQ) 204.15 or the 10 DMA support 207.91 ATH.
KRE (Regional Banks) 57.52 now support
SMH (Semiconductors) 134.15 or the 10 DMA support. 141.93 the new ATH
IYT (Transportation) 195 is still the area to clear with 191.25 key support.
IBB (Biotechnology) 116.30 key support 122.97 the 2018 high
XRT (Retail) 45.41 must clear. 44.15 major support
