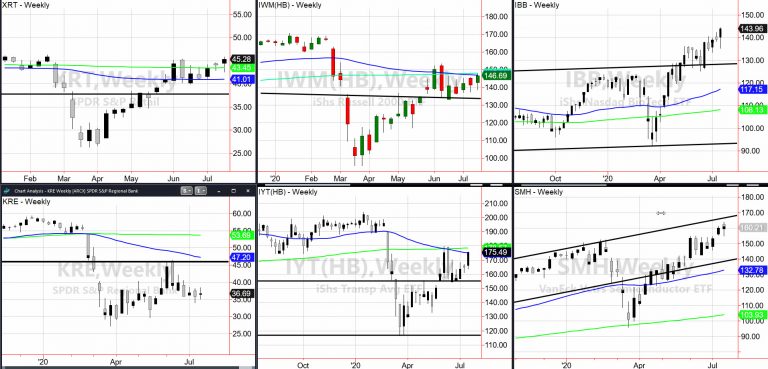
We've seen rotation out of tech and into the matriarch and patriarch of the Economic Modern Family, Retail and the Russell 2000.
However, this catch up play is a long time coming considering that Biotechnology (Big Brother) and Semiconductors (Sister) have led the charge for weeks.

Perhaps the biggest star of the show though is Transportation or our Tran-the everchanging face of the demand side of the economy.
While you hear me talk a lot about the supply side through the Russell 2000 with its 100% focus of US companies and a significant emphasis on manufacturing, Tran is our anointed superstar for now.
And the implications could be staggering.
For one, it is the only sector of the Family besides Biotechnology that cleared a key 6-month calendar range high.
Secondly, while folks focus on FAANG and specifically Netflix (NASDAQ:NFLX) earnings this past week, one company, JB Hunt (NASDAQ:JBHT), roared after great earnings to new all-time highs.
Not only is this a good sign that goods are moving hence demand is rising, but it could also be a precautionary sign for the stagflation theory I keep hammering home about.
Why?
Supply-side (particularly in the IWM basket), is now lagging demand side. Low production, supply chain disruption and the trend towards de-globalization are factors that can contribute to shortages, hence inflation.
The dollar has fallen and continues to be under threat for more declines.
Where the “stag” part of stagflation comes in is seen best through the lens of our Prodigal Son, Regional Banks.
After a slew of bank earnings with more to come this week, the investment banks fared well (Morgan Stanley(NYSE:MS) (NYSE:MS), Goldman Sachs (NYSE:GS)), but the banks that count on loans and loan payments (Wells Fargo (NYSE:WFC)) continue to see defaults, particularly in mortgage payments.
The conundrum is that folks are not paying back loans but are spending money on goods (retail sales rose to 7.5%).
Now let’s put some gasoline on that-add more stimulus hence more money supply growth forthcoming.
So where does that leave the market?
A picture tells all.
Starting top right is Granny Retail (XRT). In a weekly accumulation phase, XRT has given us a confirmation of the phase with 2 weeks closing above the 200 DMA.
XRT also cleared 45.00, which was the level it saw right before the February crash. As we can have certain market sectors rise, while inflation rises, I like XRT holding here. For me, this makes the best case for more upside. That is of course, assuming it holds 43.45.
Middle right is Granddad Russell IWM. In a weekly bearish phase, here is a bit of trouble to keep your eyes on. As I mentioned, stocks and inflation can rise to a point. But if the market catches any wind that supply-side struggles while demand-side gains, the Fed will have some tough decisions to make.
IWM needs to clear 150 to keep this rally alive.
Top left is Biotechnology IBB. Note the new all-time high close. We are not surprised as this broke from a 5-year base back in April. Now, 140 is pivotal and IBB could go to 150 or beyond.
Bottom left is the best lens for potential trouble ahead. Our Prodigal Son, KRE is in a strong bearish phase. It appears as if a right shoulder to a head and shoulders top could be forming. Only a weekly move over 45.00 will negate that while a break below 29-30.00 will get ugly.
Bottom middle is Transportation IYT. Please note that even with move in JB Hunt, this is still in a bearish phase and right into resistance at the 50-WMA.
Ideally, IYT must clear 180. Should KRE falter, then this could very fail 155. And that would mean trouble ahead.
Finally, is Sister Semiconductors SMH. Back in May, I showed you a channel that it had to clear over 140. Then, we anticipated that if 140 cleared 160 was the reasonable target.
160 is here with the top of the channel coming in at 165-168 serving as resistance. I am not too worried at this point, however if SMH gets to the top of the channel, cannot clear, and begins to turn lower, I would have no issue going short into failed strength.
The Family’ picture is elucidating.
We see the tech money continuing to flow.
We see hopes for a vaccine in our big brother Biotech.
We see the trend of folks spending money yet not necessarily paying their bills.
We see demand rising while supply languishes.
And we see the wise one-Granddad, standing with one foot in the worst case and one foot in the best case.
S&P 500 (SPY) 323.43 on watch or the early June high 317.75 support
Russell 2000 (IWM) 146 support 150 resistance
Dow (DIA) 262.50 support 270 resistance
Nasdaq (QQQ) With lots of earnings on tap, a potential bear flag forming with the breakdown under 156.50 area
KRE (Regional Banks) 36.25 support 37.70 to clear if good
SMH (Semiconductors) 160 pivotal, 157.50 support 165 resistance
IYT (Transportation) Confirmed accumulation phase- 173.40 support
IBB (Biotechnology) 140 support
XRT (Retail) 45 support then 44.35
Volatility Index (VXX) 30.00 support
Junk Bonds (JNK) 104.25 resistance 101.50
LQD (iShs iBoxx High yield Bonds) 136.10 support
