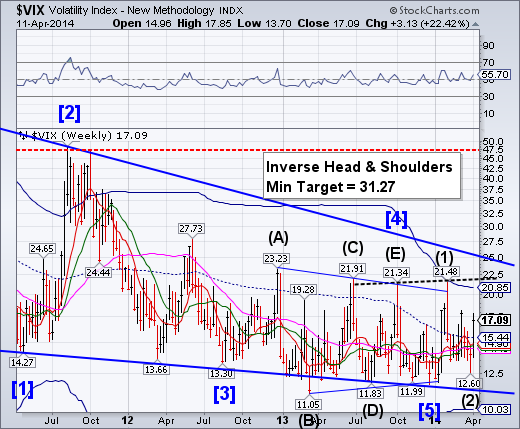
The VIX ramped above weekly mid-Cycle resistance and challenged its February high before closing beneath it. This is the start of the run to the top of the chart that may occur over the next 3-4 weeks.The press continues to “whistle past the graveyard."
SPX breaks support and Bearish Wedge trendline
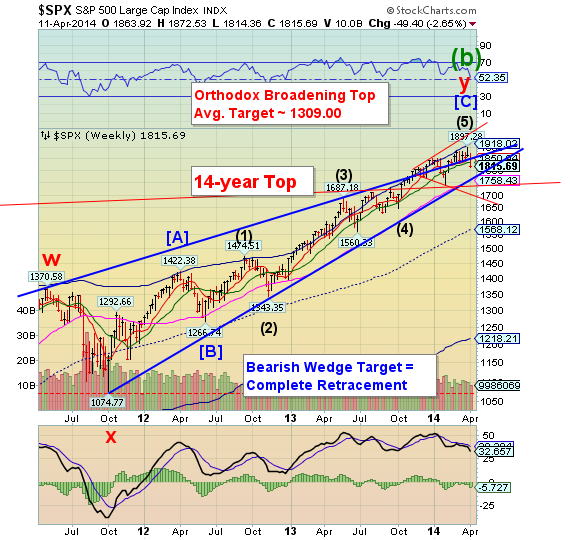
SPX made a clean break of weekly Intermediate-term support and the upper trendline of its Bearish Wedge.There is a good probability that SPX may make a 150-200 point drop beneath 1700 next week. There may also be a probable bounce due in the latter half of the week, followed by a continuation of the decline through the remainder of April.
CNNMoney: Markets are finally closed for the week after a truly bumpy ride that ended with investors running for the exits Thursday and Friday.
The weakness in the technology sector appears to be spreading to the broader stock market. The S&P 500 was down nearly 1% today with selling in all sectors. Information technology was the hardest hit, but more defensive sectors such as utilities and telecoms were also under pressure. For the week, the S&P 500 fell 2.6%.
NDX falls dramatically beneath the Ending Diagonal.
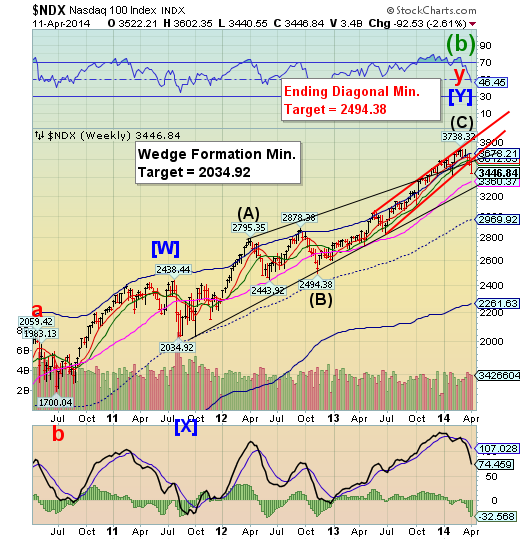
NDX declined dramatically beneathits Ending Diagonal trendline. The next level of support is at 3360.37.NDX is leading the other indexes in a decline as it has now given a seasonal sell signal.
ZeroHedge: On Tuesday of this past week I posted an article entitled "No One Rings A Bell At The Top" wherein I stated:"The current levels of investor complacency are more usually associated with late stage bull markets rather than the beginning of new ones. Of course, if you think about it, this only makes sense if you refer back to the investor psychology chart above.The point here is simple. The combined levels of bullish optimism, lack of concern about a possible market correction (don't worry the Fed has the markets back), and rising levels of leverage in markets provide the "ingredients" for a more severe market correction. However, it is important to understand that these ingredients by themselves are inert. It is because they are inert that they are quickly dismissed under the guise that'this time is different.'Like a thermite reaction, when these relatively inert ingredients are ignited by a catalyst they will burn extremely hot. Unfortunately, there is no way to know exactly what that catalyst will be or when it will occur. The problem for individuals is that they are trapped by the combustion and unable to extract themselves in time."
The Euro bounces back to its upper trendline
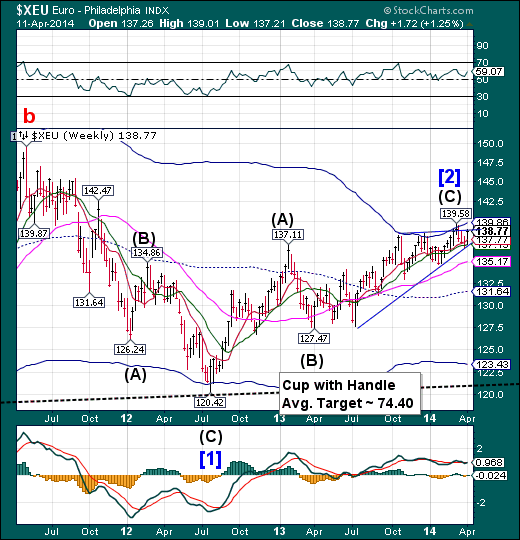
The Euro made a final bounce from the lower trendline to the upper trendline of its Ending Diagonal.The lower trendline of the Ending Diagonal is important, since a decline beneath it may imply a further decline to the July 2012 low.A break of the trendline signals that the decline back to the Lip of its Cup with Handle formation at 121.00 has begun.
Bloomberg: European government bonds advanced after Federal Reserve minutes damped speculation U.S. policy makers are moving toward raising interest rates, and as Greece returned to debt markets for the first time since 2010.
Italian bonds gained for a second day and Belgian, French and German securities also rallied. Greek bonds fell, pushing 10-year yields up from near the lowest level since February 2010, as the nation agreed to sell 3 billion euros ($4.17 billion) of five-year notes via banks. Greece received about 600 orders for a total of around 20 billion euros, a person familiar with the sale said. Ireland auctioned 1 billion euros of 10-year debt at a record-low yield.
Euro Stoxx reverses hard from the Cycle Top.
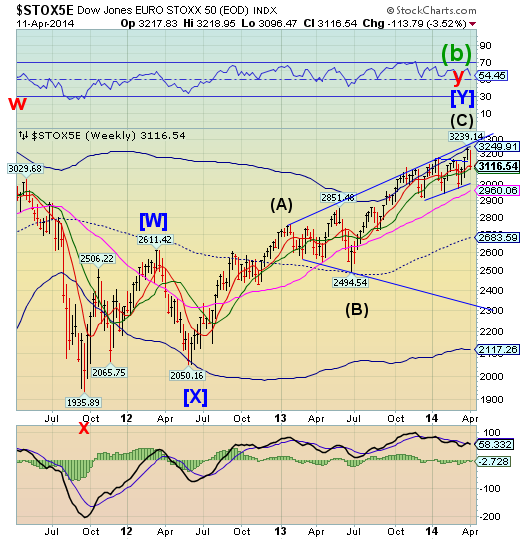
The EuroStoxx 50 index reversed down hard from its Cycle Top, challenging but not breaking Intermediate-term support at3099.40.Even though the rally from the March 14 low broke out to a new high, the top was made in 21 days, making it left-translated and bearish..
ZeroHedge: Another day ending in "y" means another day in which Putin plays the G(roup of most insolvent countries)-7 like a fiddle.
The latest: Europe should provide aid to Ukraine to ensure uninterrupted natural-gas deliveries to the region, President Vladimir Putin’s spokesman said as reported by Bloomberg.
"Russia is the only country helping Ukraine’s economy with energy supplies that are not paid for," DmitryPeskov told reporters today in Moscow, commenting on President Vladimir Putin’s letter yesterday to 18 European heads of state. “The letter is a call to immediately review this situation, which is absurd on the one hand and critical on the other.
In other words, Putin Says Europe Gas Transit Depends On Ukraine.
The Yen also rises
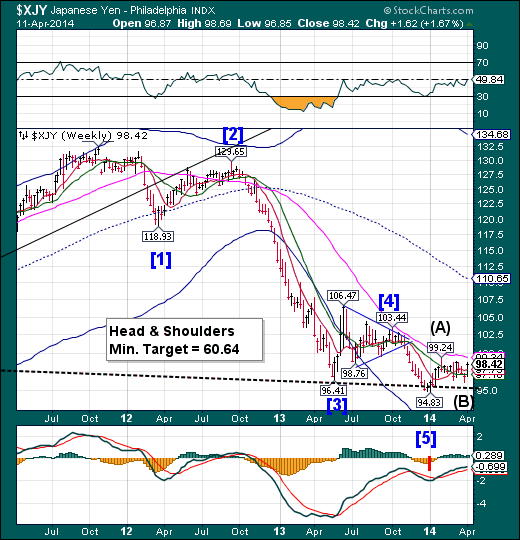
The Yen launched higher this week and appears ready to challenge weekly Long-term resistance at 99.24. Since the dollar/yen carry trade is dependent upon a declining Yen, it makes sense that equities markets declined as their source of funding was removed. This may affect the liquidity from the world equity markets for the next month as alarge retracement rally unfolds.
ZeroHedge: It took Virtu's idiot algos some time to process that the lack of BOJ stimulus is not bullish for more BOJ stimulus - something that has been priced in since October and which sent the USDJPY up from 97.000 to 105.000 in a few months, but it finally sank in when BOJ head Kuroda explicitly stated overnight that there is "no need to add stimulus now." That, and the disappointing news from China that the middle kingdom too has no plans for a major stimulus, as we reported last night, were the final straws that forced the USD/JPY to lose the tractor-beamed 103.000 "fundamental level", tripping the countless sell stops just below it, and slid 50 pips lower as of this moment to overnight lows at the 102.500 level, in turn dragging US but mostly European equity futures with it, and the Dax was last seen tripping stops below 9400.
The Nikkeisits on the Head and Shoulders neckline
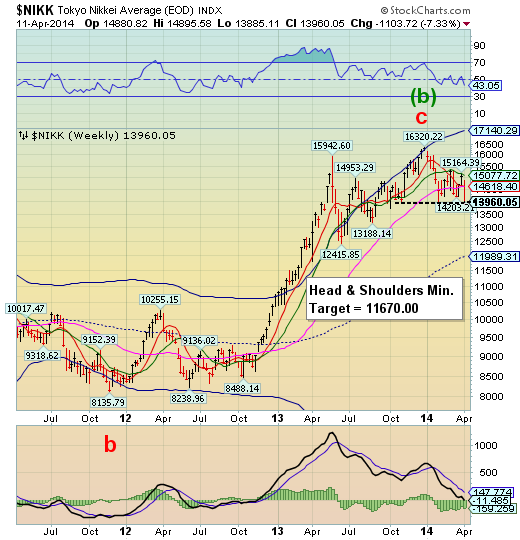
The Nikkei declined a whopping 1100 points to the neckline of its Head & Shoulders formation on Friday. Last week I suggested, “The Cycles Model calls for a probable 4-week decline that may break the Head & Shoulders neckline and meet its target.” This is an auspicious start to a monster decline.
MarketWatch: Japanese stocks tumbled to their lowest level this year in early Friday trading, hit by Wall Street’s overnight fall, a stronger yen, and selling by foreign investors.
The Nikkei Stock Average opened sharply lower, falling quickly to its lowest level since late October. As of 0020 GMT, or 20 minutes after the Tokyo Stock Exchange opened, the index was down 2.8% at 13904.75.
The Nikkei has not closed under 14,000 since late October, leading many investors and analysts to believe that level represented a so-called “hard floor” of support.
U.S. Dollar loses most of its prior gains
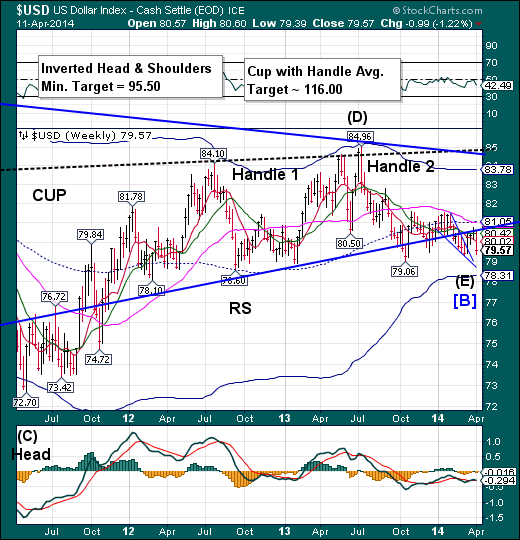
The Dollar lost most of its hard-earned gains made since March 13, but did not make a new low. It appears that the decline may have ended on Thursday, which allows for the Cycle to go higher.A challenge of, or a breakout above, mid-Cycle resistance at 81.05 will confirm a probable new uptrend.
Reuters: The safe-haven U.S. dollar edged higher on Friday, garnering support from a selloff in equities around the world, as investors fretted about overstretched valuations.
Global equities fell to two-week lows, triggered by selling on Wall Street on Thursday. Wall Street stocks continued their decline on Friday, spurring a broad risk-averse environment that led to selloffs in higher-yielding and emerging market currencies.
"Bad news for the world is good news for the dollar," said Steven Englander, managing director and global head of G10 FX strategy at CitiFX in New York. "Once fears about the equity market intensified, they picked up a more conventional type of mode to buy the dollar."
Treasuries spike higher
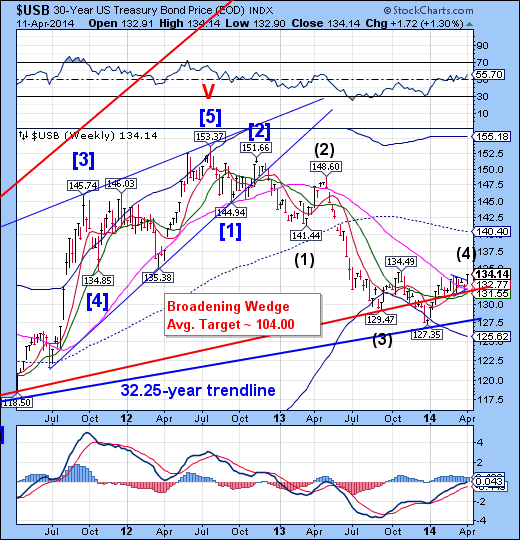
Treasuries spiked out of its Triangle formation to rise above its two-month sideways consolidation. But it may not last, since there is daily resistance near 135.00 (not shown).In addition, USB has a date with a major Cycle bottom near the end of May.
WSJ:Treasury bonds strengthened Friday and logged the biggest weekly price gain in a month as investors sought safety in bonds.
Demand for ultra-safe U.S. government debt rose over concerns about the U.S. stock market. Shares of high-flying biotechnology and Internet firms led the selloff as concerns grew that they are overpriced.
Reassurances from the Federal Reserve's minutes from its March policy meeting earlier this week that it will be in no rush to raise interest rates has added to the bond market's strength.
Gold bounce meets resistance
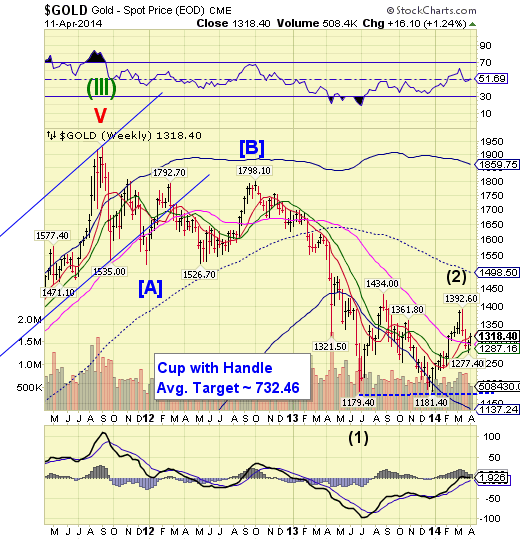
Gold gained additional traction off its Long-term support at 12982.04 and managed to close just beneath Short-term resistance at 1321.30.Not overcoming its final resistance makes it susceptible to a reversal. It appears that the decline may impose itself again soon.
CNBC: This week last year, the price of gold suffered a 15 percent drop inside two trading days. It was a volatile year for the precious metal -- 2013 finally put an end to a 12-year bull run. And that is unlikely to be reversed no matter how volatile the markets get, analysts have told CNBC.
Gold has been trading near two-and-half-week highs and is on track for its best week in a month as equity markets have been hit hard and tensions continue to mount in Ukraine.
Will it be déjà vu all over again?
Crude falls short of a breakout
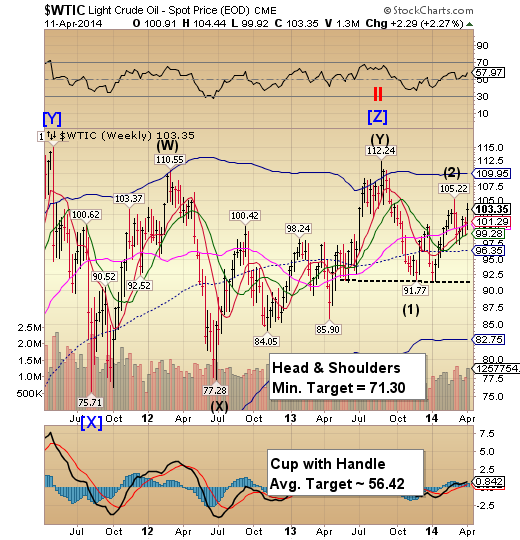
Crude has been edging higher, attempting to make new highs.However, this may not happen, since Friday was the last day in an inverted Trading Cycle. A reversal next week would leave this Cycle left-translated and bearish.A subsequent decline may lead to the Head & Shoulders formation at the base of this rally, which may be overshadowed by the Cup with Handle formation with an even deeper target.
MarketWatch: Oil futures finished higher on Friday as a rise in U.S. consumer sentiment to a nine-month high buoyed the outlook for energy demand, and after the International Energy Agency reported much lower OPEC production in March and warned of the prospects for further output declines.
Crude oil for May delivery CLK4 -0.03% tacked on 34 cents, or 0.3%, to settle at $103.74 a barrel on the New York Mercantile Exchange after tapping a high at $104.44. For the week, prices scored a 2.6% gain, based on the most-active contracts.
China spikes, but doesn’t achieve lift-off
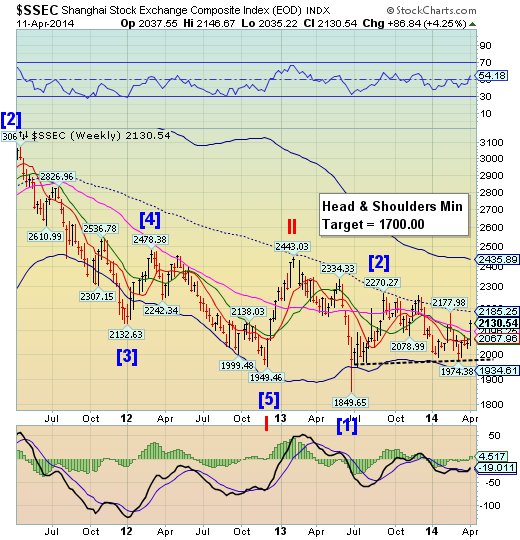
The Shanghai Index spiked above its Model resistance levels to its weekly high on Thursday, day 29 in the new Cycle. Should the index fail next week, the Cycle may be left-translated and bearish. The ensuing decline may be swift and deep. There is no support beneath its Cycle Bottom at 1934.61.
ZeroHedge: Last night's devastating trade data from China had the bad-news-is-good-news crowd chomping at the bit over the next massive stimulus that 'surely China will unleash...because they've got so much in reserves'. However, as we have explained previously, Chinese premier Li Keqiang destroyed those expectations last night when he ruled out major stimulus to fight short-term dips in growth. Unlike his 'desperate for a short-term fix' colleagues in the west, Li stated more thoughtfully (and perhaps more knowingly given his country's pending credit bubble crash), "we will instead focus more on medium- to long-term healthy development."
The Banking Indexfalls out of bed
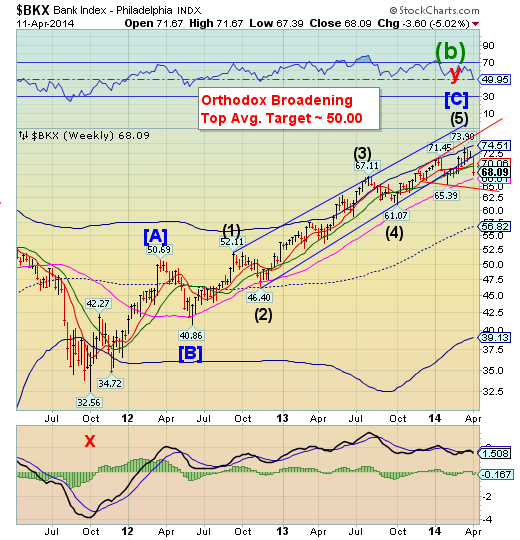
BKXdropped below its trading channel trendlineand violated all but Long-term support at 66.61. The next target is below its Orthodox Broadening formation.A bounce from beneath the Broadening Top may heighten the probability of a flash crash soon after.
ZeroHedge: Yet again, it seems, once senior political or economic figures leave their 'public service' the story changes from one of "you have to lie, when it's serious" to a more truthful reflection on reality. As Finanz und Wirtschaft reports in this great interview, Bill White - former chief economist of the Bank for International Settlements (who admittedly has been quite vocal in the past) - warns of grave adverse effects of the ultra loose monetary policy everywhere in the world... "It all feels like 2007, with equity markets overvalued and spreads in the bond markets extremely thin... central banks are making it up as they go along." Some very uncomfortable truths (are) in this crucial fact-based interview.
ZeroHedge: Overnight, Bloomberg released its analysis of a Basel derivatives rule proposed last year according to which banks would be required to set aside more money in the event swaps making up the $693 trillion swaps market go bad. "And not just a little bit more -- as much as 92 times, or 9,100 percent, more, according to calculations by three banks shared with Bloomberg News. The higher costs in turn may cause market participants to flee rather than take advantage of the clearinghouses, making it more difficult for those third-party guarantors."
ZeroHedge: It was about 5 years ago, roughly the same time we launched our crusade against HFT, that we also first made the accusation that as a result of QE and the Fed's central planning, the forward-looking, discounting mechanism formerly known as the "market" no longer exists, and instead has been replaced with a policy vehicle designed to create a "wealth effect" if only for those already wealthy. In other words, while HFT may have rigged the market, it was the Fed that has openly broken it.
Today, none other than the WSJ is the latest to confirm this.
Forbes:JPMorgan Chase JPM -3.66% & Co., the nation’s biggest bank, kicked off big bank earnings season in a bad way on Friday, reporting net income of $5.27 billion, or $1.28 per share, missing analyst expectations of $1.40 per share. The bank’s first quarter profits in 2014 dropped sharply from the previous year, when JPMorgan Chase reported $6.53 billion in earnings, or $1.59 per share.
The news was bad for big banks, suggesting that the weakness that had hit the shares of some big financial firms in recent weeks like Goldman Sachs,Morgan Stanley MS -2.67%, and Citigroup C -1.19%, would move to other large banks that are either more diversified or have not been hit by recent scandal like Citigroup’s Mexico unit. Shares of JPMorgan fell by 3% in pre-market trading.
