REVIEW
The market started the week at SPX 2344. After a gap down opening on Monday to SPX 2322 the market moved higher for the rest of the week. On Tuesday the SPX hit 2364, pulled back to 2353 on Wednesday, then hit 2370 on Thursday. On Friday it ended the week at SPX 2363. For the week the SPX/DOW gained 0.55%, and the NDX/NAZ gained 1.40%. Economic reports were mostly positive. On the downtick: consumer sentiment, the WLEI and the Q1 GDP estimate. On the uptick: Case-Shiller, consumer confidence, pending home sales, Q4 GDP, personal income/spending, the PCE and the Chicago PMI. Next week’s reports will be highlighted by the monthly payrolls report and the ISMs.
LONG TERM: uptrend
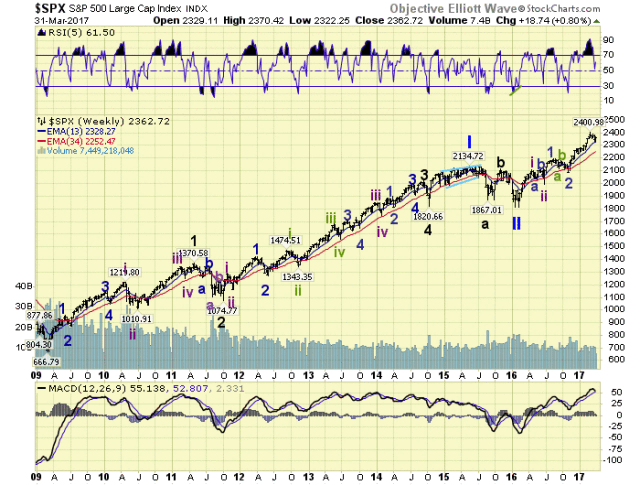
Friday ended the week, the month, and the quarter. For the month the SPX lost just 1-point, but for the quarter it gained a respectable 5.5%. During the quarter a new president took office, many executive orders were signed, two immigration orders were blocked by the courts, and a new healthcare bill didn’t gather enough support to even receive a vote. Not much accomplished. The FED, however, raised rates to 0.75% – 1.00%, their third rate increase since December 2015. Consumer confidence, small business confidence, and home builder confidence all hit their highest levels in 13 years. While the new administration is trying to get their policies underway, and rates are being nudged back up to normal. There is a growing consensus of optimism, despite the partisanship on Capitol Hill.

The new bull market that started at SPX 1810 in February 2016 continues to unfold. And, it has already gained nearly 33% in less than 14 months. We continue to label this bull market as a Major wave 1 of Primary wave III. Primary waves I and II completed in 2015/2016. Thus far, Intermediate waves i and ii completed in April and June, and a subdividing Int. iii has been underway since then. Minor waves 1 and 2, of Int. iii, completed in August and November, and Minor wave 3 has been underway since then. When Minor 3 concludes the market should experience at least a 5% decline. Then a Minor wave 5 uptrend should take the market to all-time highs.
MEDIUM TERM: uptrend
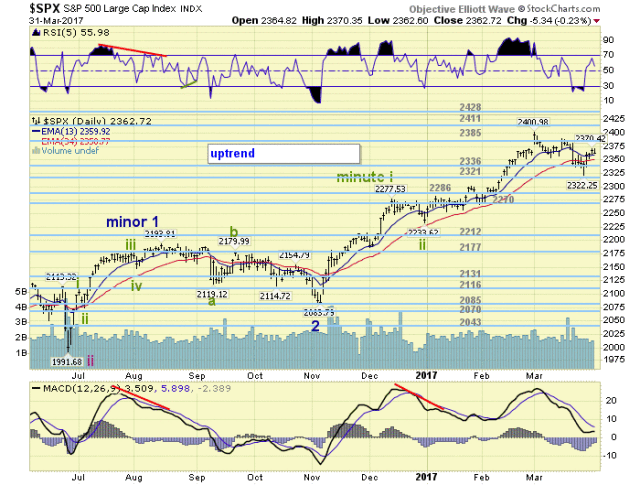
This Minor wave 3 uptrend began in early November, just before the election. It is already the longest and strongest uptrend since the bull market began. Typical wave 3 activity. We have labeled this uptrend unfolding in five Minute waves. From the SPX 2084 low in November: Minute i SPX 2278, Minute ii SPX 2234, and Minute iii SPX 2401 thus far.

During the month of March the market had its biggest pullback since the uptrend began: 79-points v just 44-points in December. Since the December activity marked a Minute ii low, this recent activity could be marking a Minute iv low with a Minute v currently underway. This would suggest one more series of new highs to end this Minor 3 uptrend. Our short term count, posted below, suggests two more series of new highs before the uptrend ends.
While short term counts often work well in OEW, they are not perfect. Trends, medium and long term, are what defines OEW and separates it from standard EW. With this in mind the market is now at trend-noteworthy juncture. While the uptrend is still in force it will not take much to the downside to confirm a new downtrend. Should the SPX drop back to the OEW 2336 pivot again, and break through it, it is possible a new downtrend, Minor wave 4, would be confirmed shortly thereafter. Then a further decline into the OEW 2270 and 2286 pivots could follow. Short term counts aside, the market is at an important juncture. Medium term support is at the 2336 and 2321 pivots, with resistance at the 2385 and 2411 pivots.
SHORT TERM
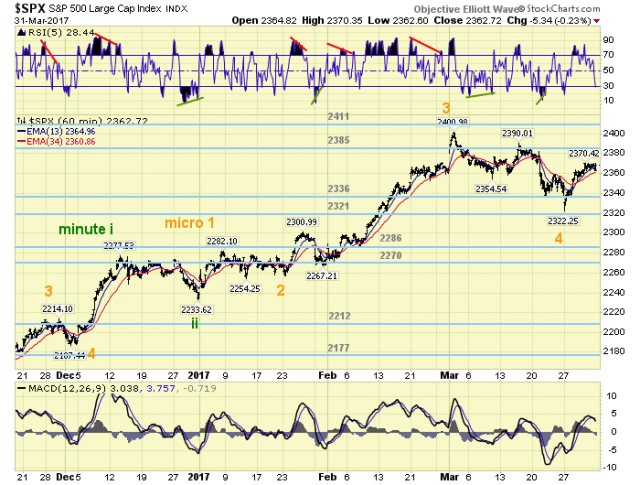
Barring a downtrend confirmation we continue to track our short term count posted on the SPX hourly chart. We currently have the market rallying in Micro 5 of Minute iii as noted. The Micro 5 rally should take the market to new highs to complete Minute iii. Then after a small Minute iv pullback, another rally to new highs should complete Minute v and the Minor 3 uptrend.

We have been noting for weeks, after the OEW 2385 pivot target was achieved, the market could experience lots of choppy activity as all that was left for the uptrend was fifth waves. Nevertheless, we did not expect such a big pullback immediately after reaching that target. With this in mind, and the fact that medium/long term trends supersede all internal counts, some caution is advised going forward for the short/medium terms. Longer term all uptrends are followed by partial retracement downtrends during bull markets. Short term support is in the SPX 2350’s and the 2336 pivot, with resistance at the 2385 pivot and SPX 2401. Short term momentum ended the week oversold. Best to your trading in the week ahead.