
Opening with a sizable bullish gap, the buyers strived to make a run. After conquering the initial wave of selling, they essentially retested the daily highs before giving up all ground gained in the opening gap. Does that mean that the bullish case is lost? Not at all, as our profitable long position taken earlier today (it brought us a 19-point gain) shows.
But let’s take it from the weekly chart examination (charts courtesy of http://stockcharts.com).
These were our Monday’s observations:
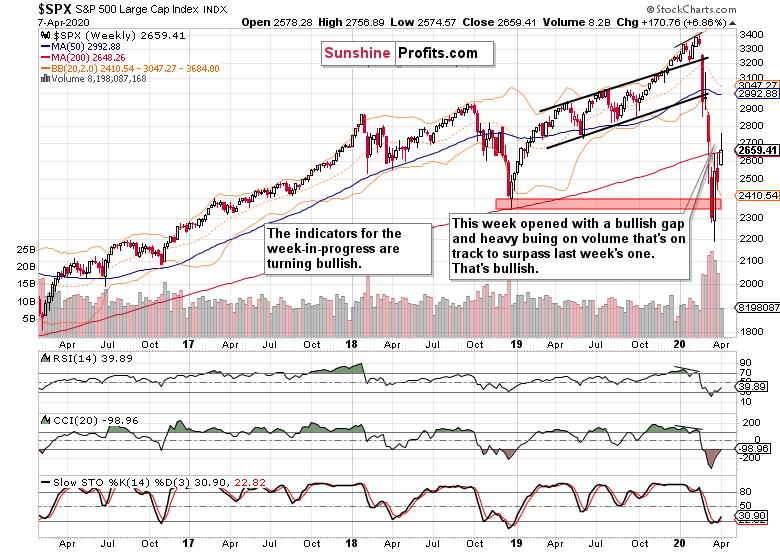
The latest weekly candle shows that the upswing attempt was rejected and prices declined again. Weekly indicators still remain in bearish territory, and their curling higher has run into stiff headwinds. There is one cautionary sign for the bears though. It is the lower volume of the downswing when compared against the preceding upswing’ one. This can either mark a normal pause in the continuing downswing, or herald a move higher.
True, it could have been said that Stochastics has flattened out and a buy signal was at hand before Monday’s session – but we’ve witnessed the very same setup going into the previous Monday already, and the whole week ended down in S&P 500. That’s why some traders (count us along) are cautious in acting on such signals originating in the extreme territory, and prefer for the indicator to clear that area first.
The same goes for RSI peeking into positive territory, which might be eagerly jumped on as a buy signal. Again, that would have led to a whipsaw last week. CCI was simply at too strong a downtrend reading back then.
But what about now – how does the week in progress shape up?
The weekly indicators are positioned more constructively for the bulls, attuned to the underlying price action. That’s where our earlier long calls came from.
What about the daily chart?
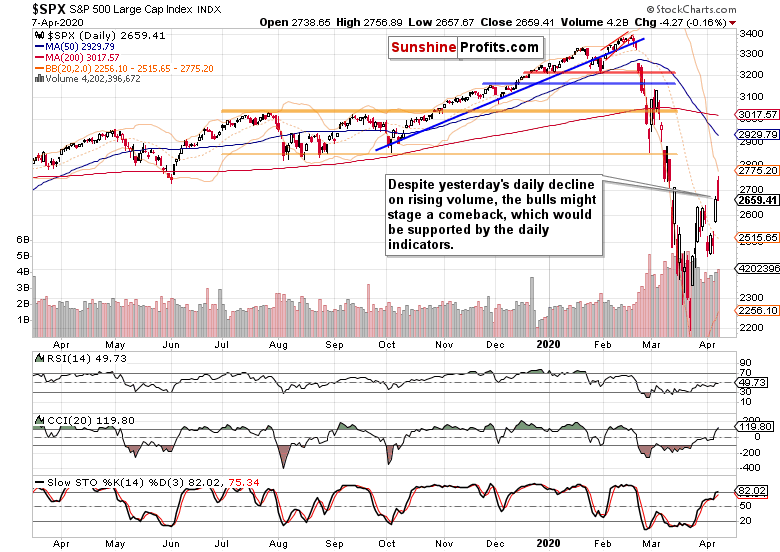
Stocks closed little changed from Monday’s closing prices. In other words, the bears managed to close the sizable opening gap, and there was no follow-through buying since the opening bell.
Certainly, that’s a bearish turn of events. But the daily indicators remain positioned positively going into today’s session. That’s why we bought into the developing premarket upswing for the above-mentioned 19-point gain. It’s not unimaginable that the bulls will attempt another run higher later today, but can it stick?
Technically speaking, it doesn’t appear likely that attempts to take out 2750 would last too long. Fundamentally speaking, that encouraging piece of daily coronavirus news from NYC, Spain or Italy, appears to be overshadowed by the incoming data (regardless of those positive ones out of China or Hong Kong). It surely rings of a false dawn, economic consequences are still to come and be accounted for.
Let’s check our two debt markets – HYG and HYD – for more clues.
The high-yield corporate debt (HYG ETF) is the one unsupported by the Fed.
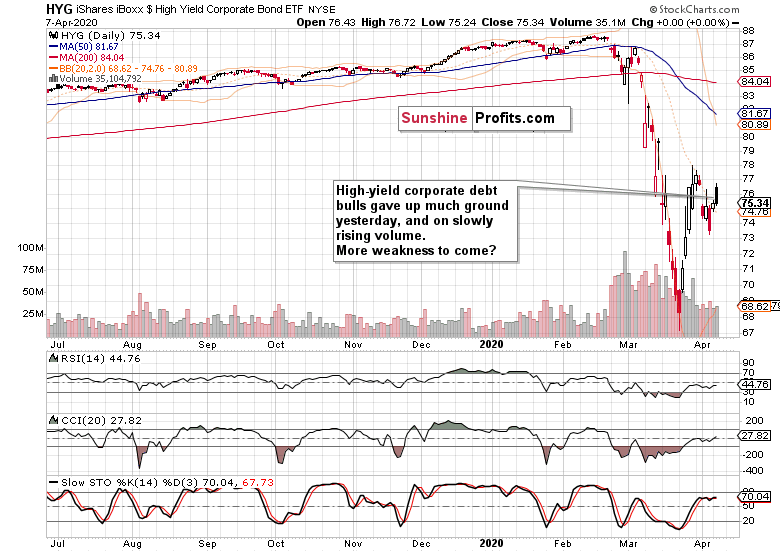
Similarly to the S&P 500 (SPY (NYSE:SPY) ETF), the opening gains evaporated before the session was over. It happened on volume with rather neutral implications, and the daily indicators aren’t decisively positioned either way. Perhaps municipal bonds had a better day because the Fed intervenes there?
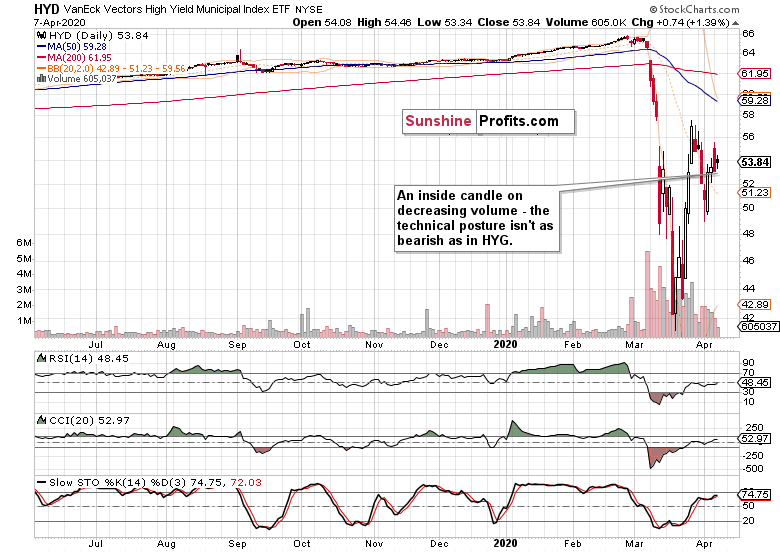
Yesterday brought us an inside candle, which marks indecision. While the daily indicators are positioned similarly to HYG, the technical posture isn’t as bearish because this instrument is trading farther above its preceding swing lows and also nearer to its recent highs. Also, thanks to the Fed’s actions, the rebound from the mid-March lows has been stronger.
Overall though, both markets are sending a mixed message for the very short-term outlook.
What about the daily Force index (it takes into account both the price move and the volume behind) and daily volatility (Bollinger Bands Width)?
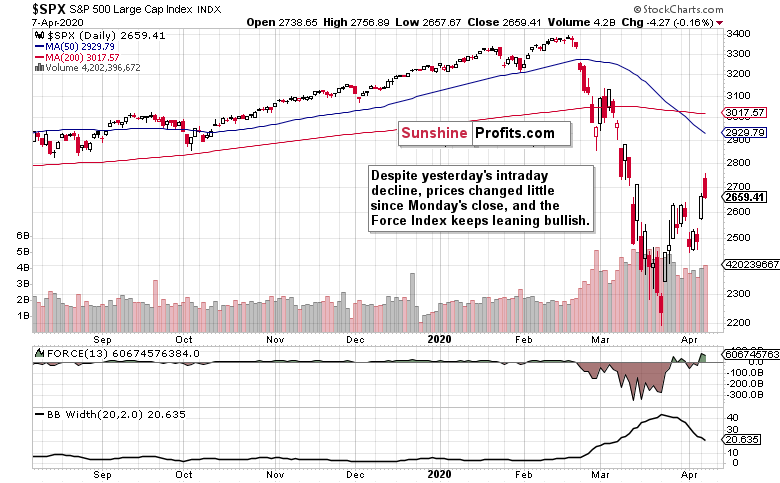
Despite yesterday’s large red candle, the Force index remains in the positive territory, because the day-to-day price change hasn’t been large. Thus, it keeps being positioned constructively for now.
Despite the short-term bullish S&P 500 move, the fluid coronavirus impact situation will facilitate the return of the bears. While the bulls let go of their reins yesterday, they might attempt to push higher again later today. We’ll monitor the developing situation and let you, our subscribers, know of any new trading decisions.
Summing up, the bulls seized the short-term momentum, and a short-term bottom looks very likely to be in. Despite the upswing though, stocks aren't out of the woods just yet. While bidding their time, the sellers are highly likely to become active at the nearest opportunity, which however doesn't appear to be immediately at hand. The bulls enjoy the benefit of the doubt but they better act fast.