First the good news: The “trend” of the stock market is bullish (and least based on the particular trend-following indicators that I follow) and I am hoping for a standard issue “Santa Claus Rally.” But hey, you’re not a real investor if you’re not worried about something. So for the benefit of my fellow worrywarts, let me point out a few warning signs looming ominously on the horizon.
Margin Debt Declines
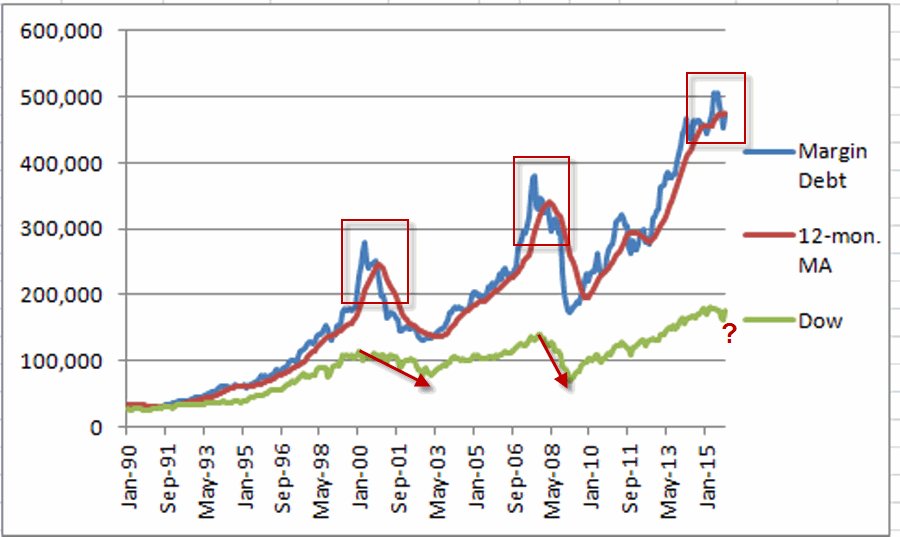
In this article I detailed a model for using margin debt and credit balances to help identify the trend of the stock market. The Bad News: it just turned bearish. Does this mean we should “sell everything”? Not necessarily. But it is also not something to dismiss. As you can see in Figure 1, the last two major contractions in margin debt were followed by something “nasty” in the stock market (more specifically, the 2000-2002 bear market and the 2008-2009 bear market).
Figure 1 – A warning sign from margin debt contraction
Jay’s Margin Debt and Credit Balance in Margin Accounts Model
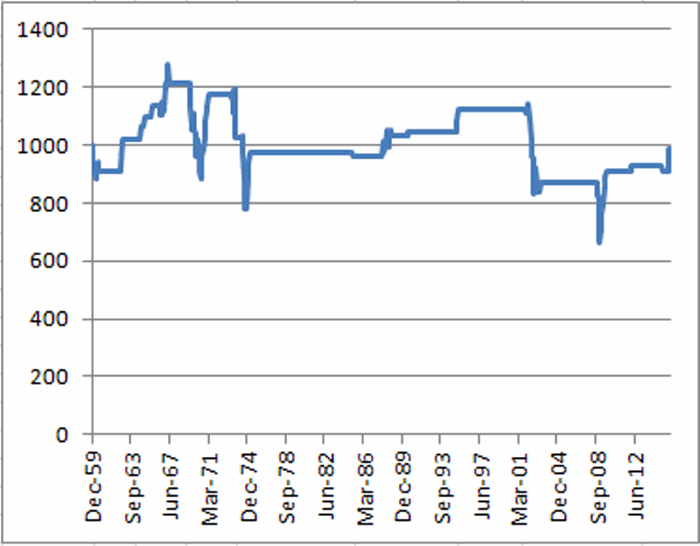
This model is described in detail here so I’ll not take the time to spell it all out again (Sorry, it’s just my nature). But the relevant fact is this: both margin debt and credit balances in margin accounts are below their 12-month moving averages. Figure 2 displays the growth of $1,000 invested in the Dow Jones Industrial Average only during previous such times.
Figure 2 – Growth of $1,000 invested in Dow Jones 30 when margin debt and credit balances in margin accounts are BOTH below their respective 12-month MA
Do twin downtrends guarantee a stock market decline is imminent? Not at all. But as you can see in Figure 2, the track record isn’t too impressive.
Since December 1959:
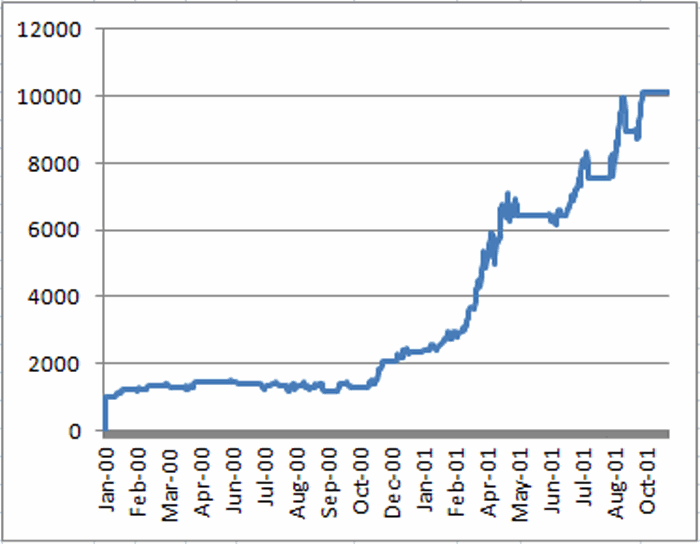
*While one of more of these two measures is bullish the Dow has gained +2,540%
*While both of the measure is bearish the Dow has lost (-1.2%)
Also, for the sake of contrast (and to highlight the potential usefulness in tracking this data), Figure 3 displays the growth of $1,000 invested in the Dow only when both margin debt and credit balances are above their respective 12-month moving average.

Figure 3 – Growth of $1,000 invested in Dow when margin debt and credit balances are BOTH ABOVE 12-month MA
A much “prettier picture” than the one in Figure 2, no?
Mutual Fund Cash
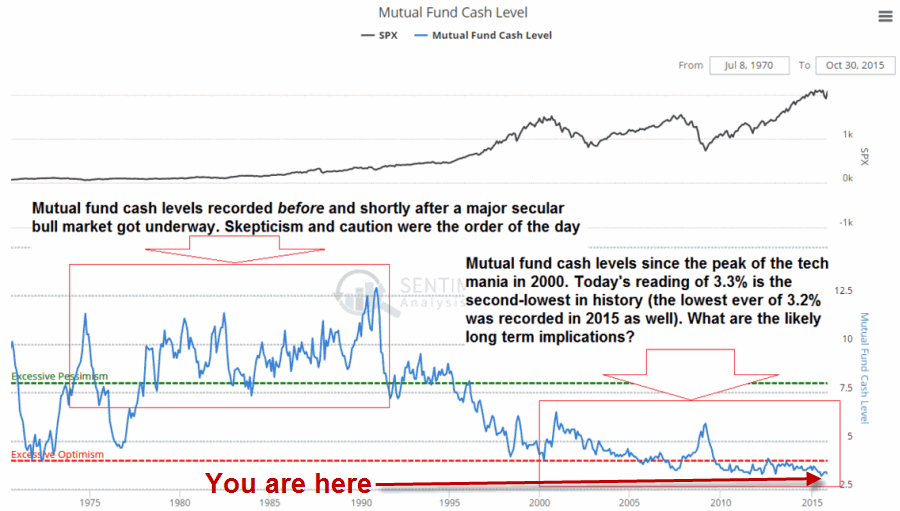
One “bonus thing to worry about”: the chart in Figure 4 is courtesy of Zerohedge.com and displays the % of cash held by stock mutual funds. Cash on hand can also be equated with “buying power”.

Figure 4 – Mutual Fund cash as a percentage of portfolio (Courtesy: ZeroHedge.com via Acting-Man.com)
As you can see in Figure 4, the current level of cash held in mutual funds is near the all-time low end of the range. While this in no way “guarantees” a bear market, more to the point, it is certainly in no way a “bullish” sign.
