
Wal-Mart Stores Inc (NYSE:WMT), reports preliminary financial results for the quarter ended January 31, 2015.
Walmart (NYSE:WMT)’s revenue rose 1.4 percent or $1.9 B to $131.6 B in the quarter ended January 30, 2015. Currency foreign exchange fluctuations negatively impacted revenue by $2.7 B. On a constant currency basis, net sales rose 3.5 percent compared to the same quarter a year ago, to $133.2 B.
Looking at the all-important retail metric of comparable sales, or sales in stores open at least a year, Walmart’s US comparable sales were up 1.5 percent for the 13 week period that included the crucial six-week holiday season. This performance beat the company’s expectations. Walmart US had increased store traffic during the holidays. E-commerce sales, which have been a focus of the company for several years, were up 22 percent globally for the year, outpacing the market. Sam’s Club had its best quarter of the year.
Walmart announced a bold new initiative to increase the pay and improve the training of its US workforce, in a bid to attract and retain talent. As of April 2015, Walmart’s full and part-time associates will all earn at least $9.00 an hour, or $1.75 more than the Federal minimum wage.
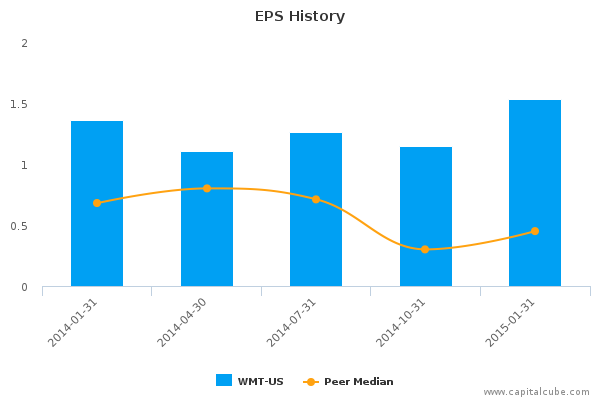
Walmart’s Earnings per Share (EPS) of $1.53 was in line with expectations.
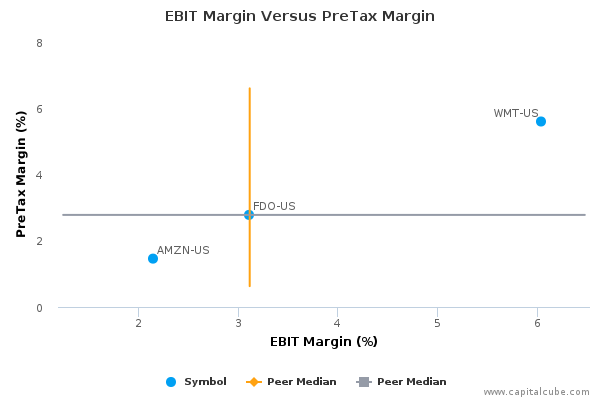
This earnings release follows the earnings announcements from the following peers of Wal-Mart Stores, Inc. – Family Dollar Stores Inc (NYSE:FDO), and Amazon.com Inc (NASDAQ:AMZN).
Highlights
- Summary numbers: Revenues of $131.56 billion, Net Earnings of $4.96 billion, and Earnings per Share (EPS) of $1.53.
- Gross margins widened from 26.22% to 26.41% compared to the same quarter last year, operating (EBITDA) margins now 7.78% from 7.41%.
- Ability to declare a higher earnings number? Change in operating cash flow of 31.77% compared to same quarter last year better than change in earnings.
- Earnings growth from operating margin improvements as well as one-time items.
The table below shows the preliminary results and recent trends for key metrics such as revenues and net income growth:

Market Share Versus Profits
Companies sometimes focus on market share at the expense of profits or earnings growth.


WMT-US's change in revenue compared to the same period last year of 1.43% lagged its change in earnings which was 15.11%. The company's performance this period suggests an effort to boost profitability. While this is good to a point, the fact that the company's revenue performance is lower than the average of the results announced to date by its peers does not bode well from a long-term market share perspective. Also, for comparison purposes, revenues changed by 10.56% and earnings by 33.82% compared to the immediate last quarter.

Earnings Growth Analysis
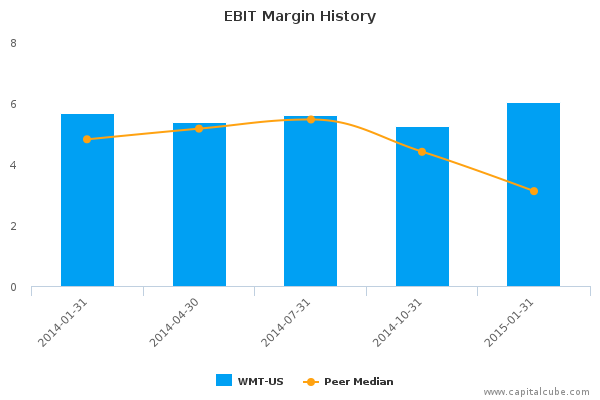
The company's earnings growth was influenced by year-on-year improvement in gross margins from 26.22% to 26.41% as well as better cost controls. As a result, operating margins (EBITDA margins) rose from 7.41% to 7.78% compared to the same period last year. For comparison, gross margins were 26.98% and EBITDA margins were 7.24% in the quarter ending September 30, 2014.

Cash Versus Earnings – Sustainable Performance?

WMT-US's year-on-year change in operating cash flow of 31.77% is better than its change in earnings. This suggests that the company might have been able to declare a higher earnings number. The change in operating cash flow is better than the average of the results announced to date by its peer group.

Margins
The company's earnings growth has also been influenced by the following factors: (1) Improvements in operating (EBIT) margins from 5.66% to 6.04% and (2) one-time items. The company's pretax margins are now 5.60% compared to 5.24% for the same period last year.


EPS Growth Versus Earnings Growth

")
Company Profile
Wal-Mart Stores, Inc. operates retail stores in various formats around the world. The company operates its business through three reportable segments: Walmart U.S., Walmart International and Sam's Club. The Walmart U.S. segment includes the company's mass merchant concept in the U.S., operating under the Walmart or Wal-Mart brand, as well as walmart.com. and also offers financial services and related products, including money orders, prepaid cards, wire transfers, check cashing and bill payment. The Walmart International segment includes numerous formats of retail stores, restaurants, wholesale clubs, including Sam's Clubs, and various retail websites that operate outside the U.S. This segment operates units in three major categories: retail, wholesale and other which consists of numerous formats, including discount stores, supermarkets, supercenters, hypermarkets, retail websites, warehouse clubs, restaurants and apparel stores. The Sam's Club segment includes the warehouse membership clubs in the U.S., as well as samsclub.com. and also offers brand name merchandise, which include hard goods, some soft goods and selected private-label items and brands in five merchandise categories namely grocery and consumables, fuel and other categories, technology, office and entertainment, home and apparel and health and wellness. Wal-Mart Stores was founded by Samuel Moore Walton and James Lawrence Walton on July 2, 1962 and is headquartered in Bentonville, AR.
CapitalCube does not own any shares in the stocks mentioned and focuses solely on providing unique fundamental research and analysis on approximately 50,000 stocks and ETFs globally. Try any of our analysis, screener or portfolio premium services free for 7 days. To get a quick preview of our services, check out our free quick summary analysis of WMT-US.