Get 40% Off
👀 👁 🧿 All eyes on Biogen, up +4,56% after posting earnings. Our AI picked it in March 2024.
Which stocks will surge next?
Unlock AI-picked Stocks

Walgreens Longer Term Outlook Remains Bearish

Published 05/01/2019, 07:26 AM
Updated 07/09/2023, 06:31 AM

WBA Weekly Chart

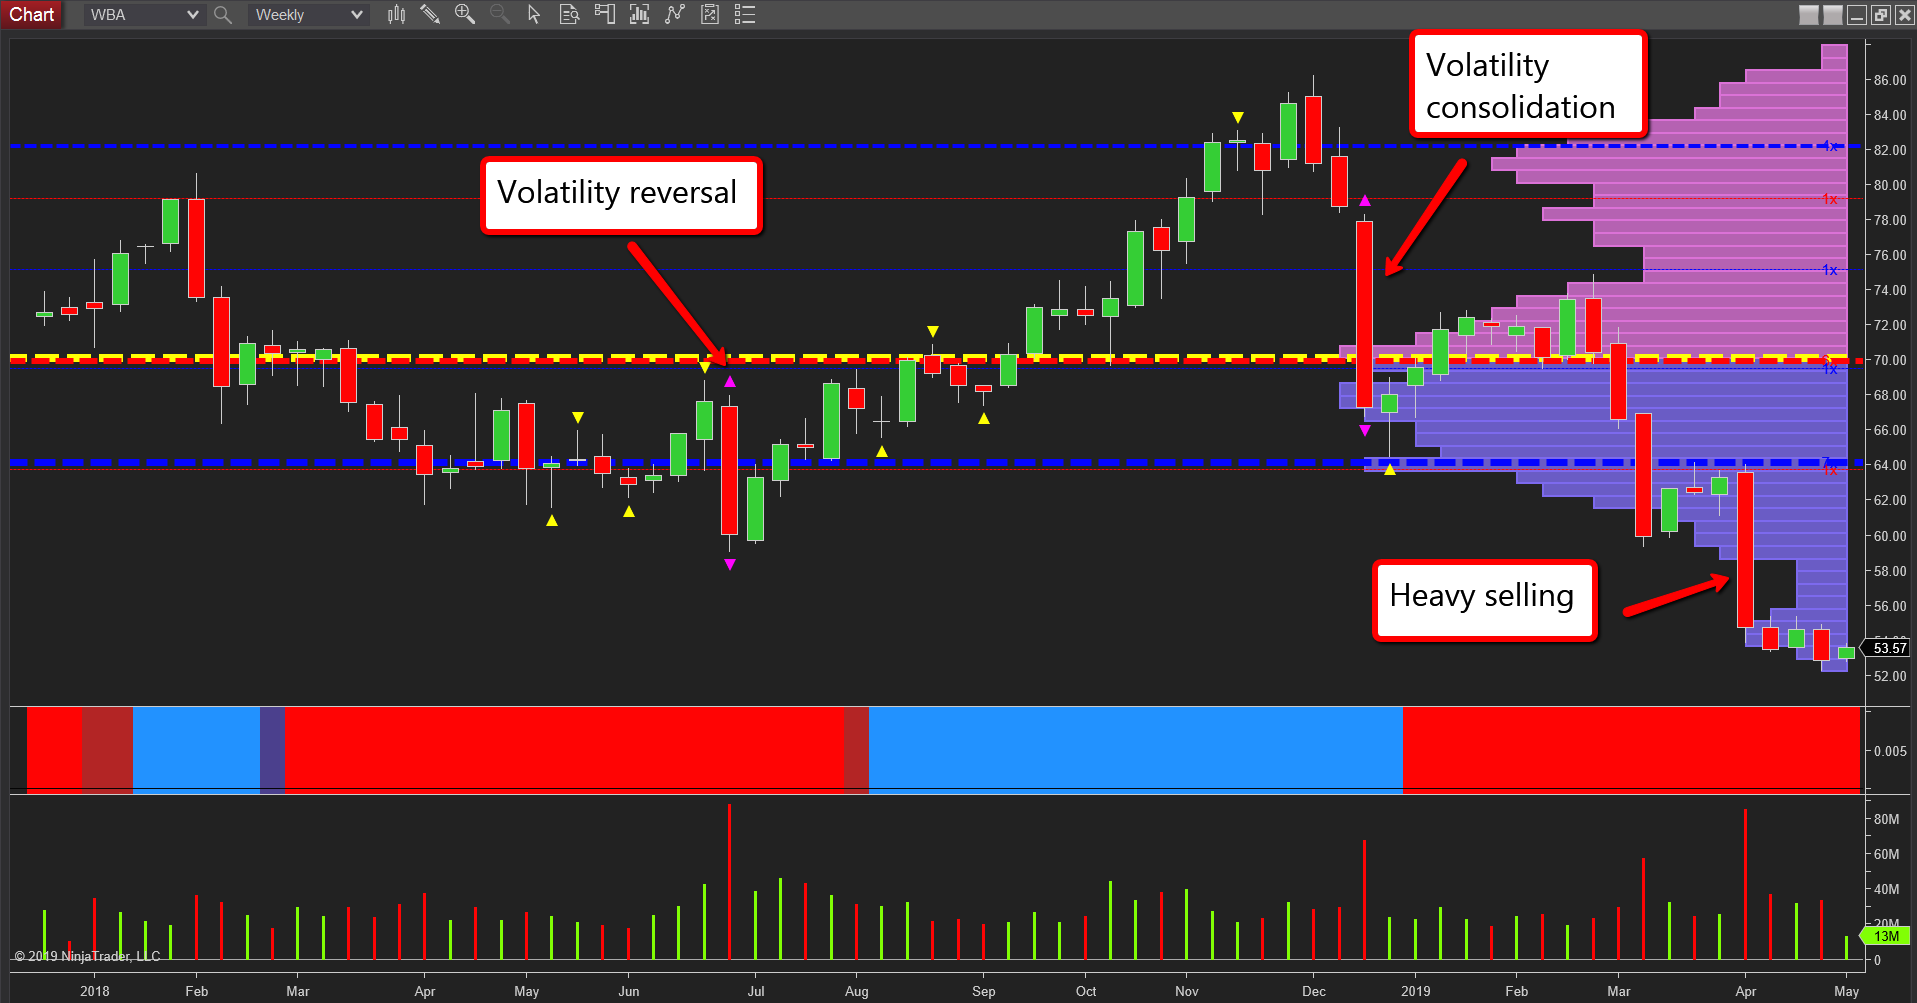
Whilst many US stocks have mirrored the price action on the primary indices over the last few months, falling and then recovering, this has not been the case for Walgreens Boots Alliance (NASDAQ:WBA) which has continued lower under the weight of a bearish technical picture and poor earnings, with a big miss in April adding to an already bearish picture. This fundamental driver is clearly in evidence on the weekly chart for the stock with the widespread down candle on ultra high volume injecting further downside momentum in April, that has continued to weigh heavily as the stock sinks further, and with no signs yet of any market maker buying, the longer term outlook remains very bearish.

What is interesting about the chart is the appearance of the volatility indicator which is unusual on a slow timeframe such as this, and yet as always reveals what to expect following its appearance. The volatility indicator is triggered when price action moves outside the average true range and the expectation is for price action to either consolidate or reverse as a result. The reason for this is simple. Volatility and insider participation go hand in hand and as such, fast moves in any market provide the ideal opportunity to trap trade investors and traders into weak positions on the reversal. And on the weekly chart, we have two examples, the first signalling a reversal, the second consolidation before there is a continuation of the primary bearish trend.
WBA Monthly Chart

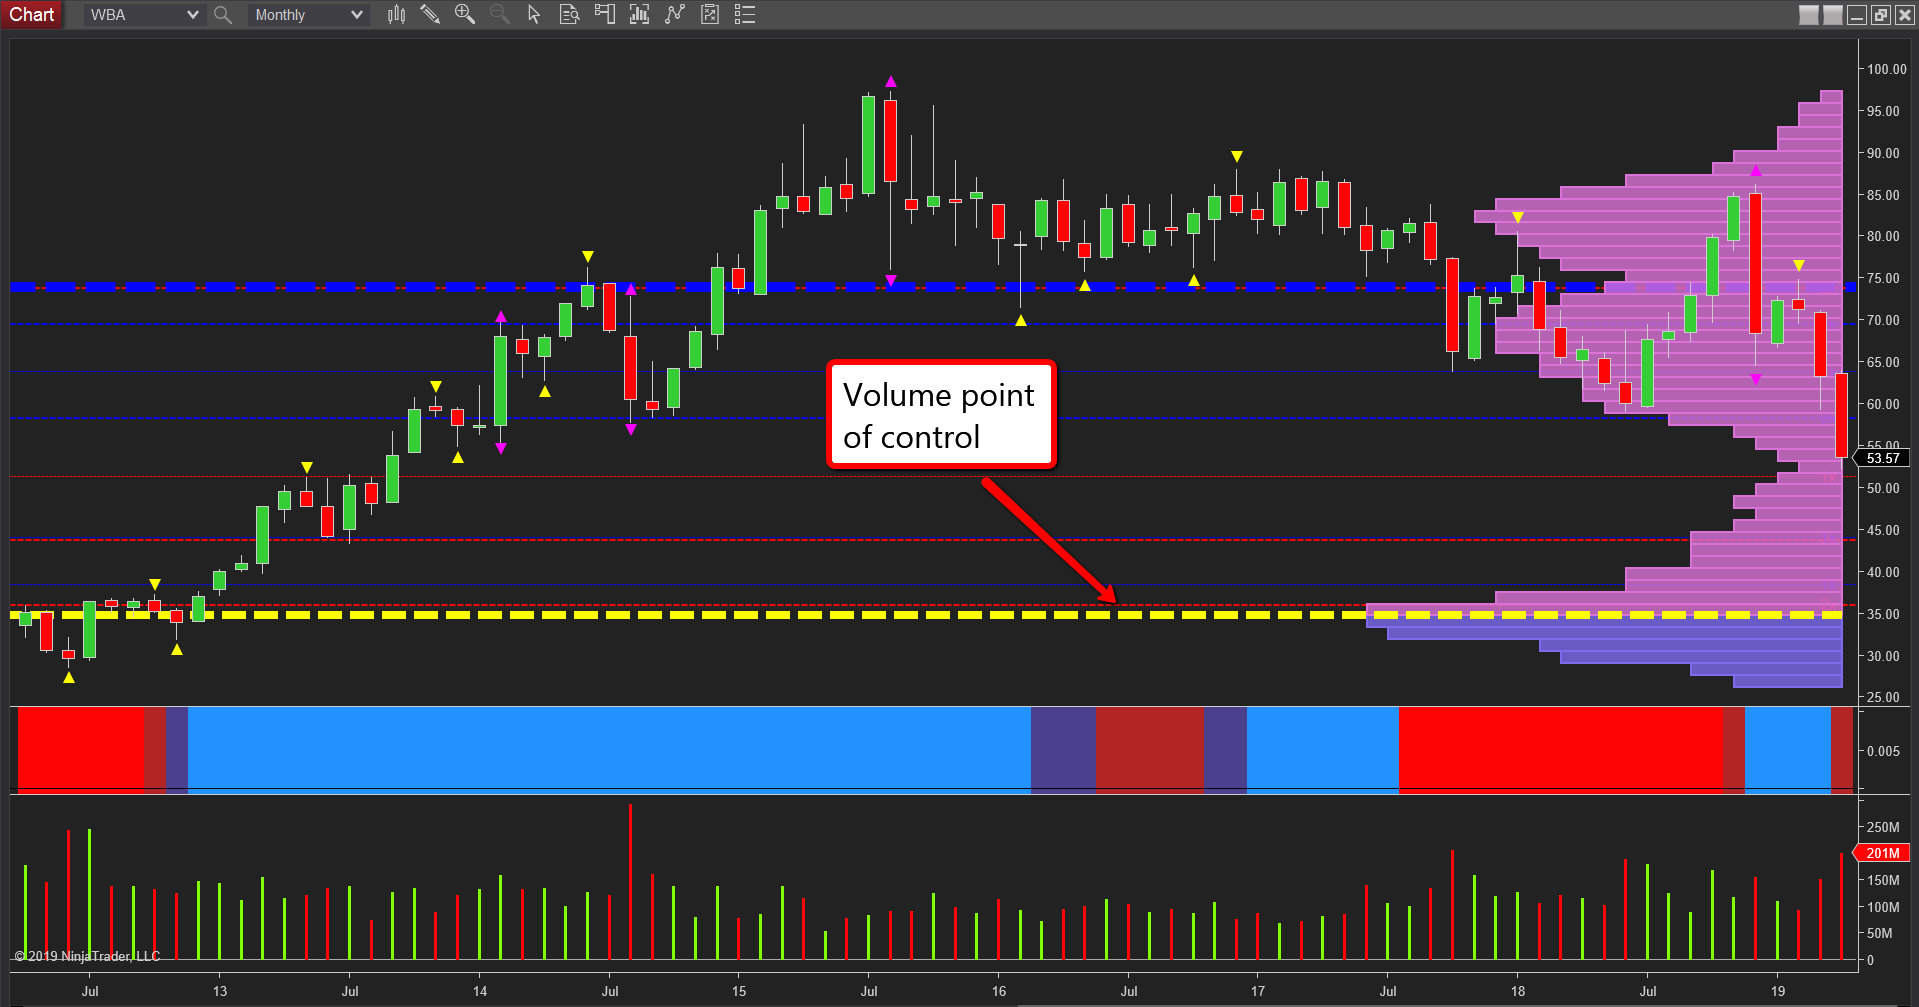
The pattern for this stock now seems to be set, with minor rallies higher punctuating the move lower, and until we see major accumulation, a move through $50 now seems likely. Indeed the monthly chart is interesting here, with rising volumes and falling prices confirming this sentiment, and with the trend monitor now in transitional phase, and with a low volume node ahead, $45 now seems to be the next possible pause point. Thereafter a return to the volume point of control at $35 longer term may be achieved.

3rd party Ad. Not an offer or recommendation by Investing.com. See disclosure here or remove ads .

Latest comments

Risk Disclosure: Trading in financial instruments and/or cryptocurrencies involves high risks including the risk of losing some, or all, of your investment amount, and may not be suitable for all investors. Prices of cryptocurrencies are extremely volatile and may be affected by external factors such as financial, regulatory or political events. Trading on margin increases the financial risks.
Before deciding to trade in financial instrument or cryptocurrencies you should be fully informed of the risks and costs associated with trading the financial markets, carefully consider your investment objectives, level of experience, and risk appetite, and seek professional advice where needed.
Fusion Media would like to remind you that the data contained in this website is not necessarily real-time nor accurate. The data and prices on the website are not necessarily provided by any market or exchange, but may be provided by market makers, and so prices may not be accurate and may differ from the actual price at any given market, meaning prices are indicative and not appropriate for trading purposes. Fusion Media and any provider of the data contained in this website will not accept liability for any loss or damage as a result of your trading, or your reliance on the information contained within this website.
It is prohibited to use, store, reproduce, display, modify, transmit or distribute the data contained in this website without the explicit prior written permission of Fusion Media and/or the data provider. All intellectual property rights are reserved by the providers and/or the exchange providing the data contained in this website.
Fusion Media may be compensated by the advertisers that appear on the website, based on your interaction with the advertisements or advertisers.
© 2007-2024 - Fusion Media Limited. All Rights Reserved.