An ideal volatility investment would hold its value during quiet times and then ride volatility up as the market panics. Barclays’ S&P 500 Dynamic VEQTOR ETN (VQT) is one of the two Exchange Traded Products (ETPs) that Barclays has designed to try and fill this need (the other is iPath's S&P 500 Dynamic VIX ETN (XVZ)).
I created a spreadsheet to simulate VQT’s allocation methodology (click here for more information) and then backtested the fund’s performance back to March of 2004—the beginnings of VIX futures trading. The results are shown below, compared to an equivalent investment in the S&P 500.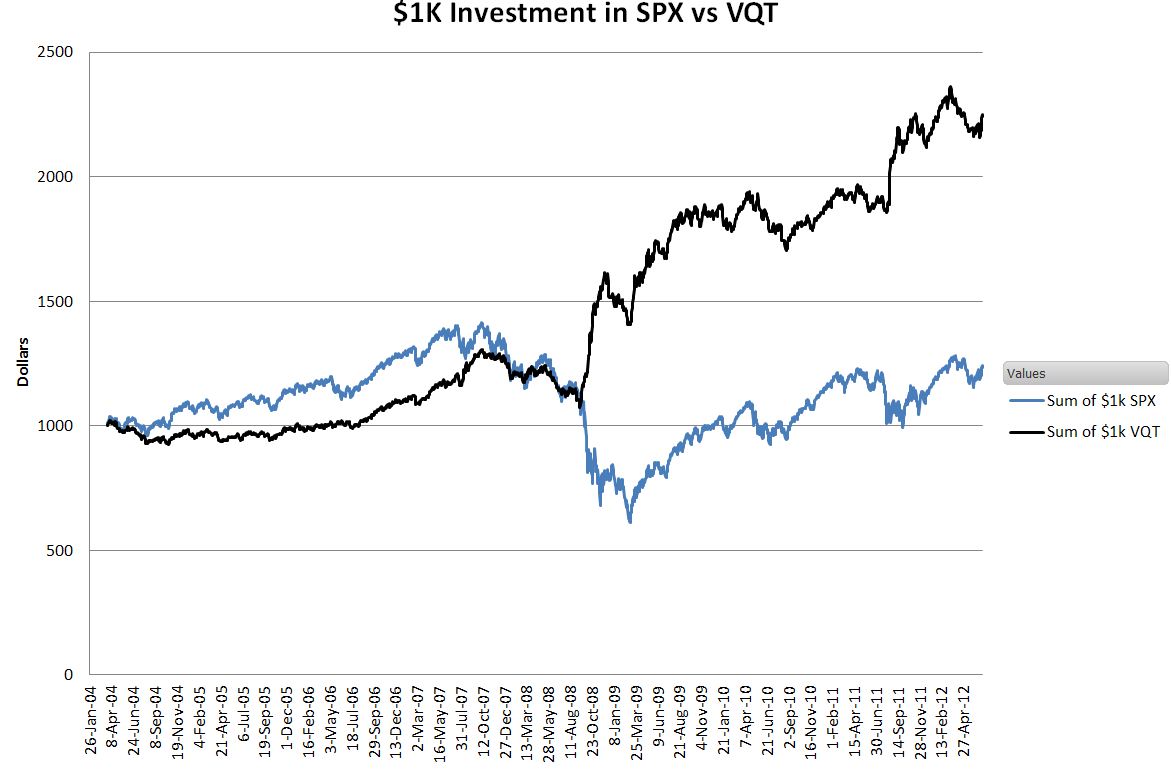
Impressive. Of course, past performance is no guarantee of future success—UBS’s E-TRACS Daily Long-Short VIX ETN (XVIX) is an example of a volatility fund that backtested great, but has gone nowhere since introduction.
VQT reacts to market dynamics by shifting its allocations as often as daily between the S&P 500, a VIX futures position (essentially VXX without the fees), and cash. There are five S&P 500 / Volatility settings: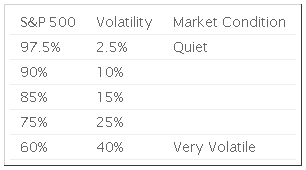
VQT also has a panic room. If the fund drops 2% or more in the last 5 business days it triggers a stop loss that shifts everything to cash for up to 5 days.
By monitoring the S&P 500’s volatility and trends in the CBOE’s VIX index VQT’s algorithms determine which of the 5 non-panic settings to use. The S&P 500’s historical volatility for the last month is the big knob, and then volatility trends are used to tweak the settings up or down one. The realized volatility breakpoints are 10%, 20%, 35%, and 45%. The chart below shows the S&P 500 volatility compared to these trigger points since 2004. The SPX itself is shown also; its scale is on the right.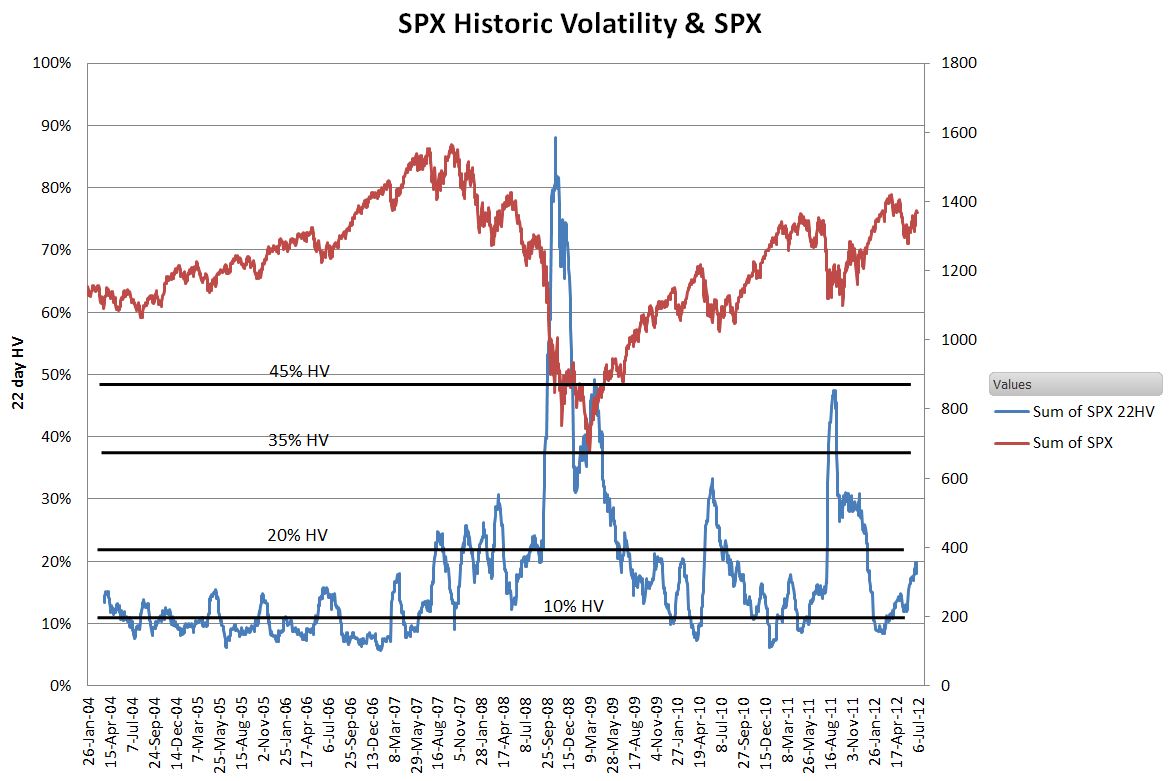
The volatility trend metric that VQT uses monitors the 5 and 15 day moving averages for VIX. If the short term average is higher than the longer term average for ten days the trend is judged to be up (+1), and if the long term is higher than the short term the trend is down (-1). Otherwise the trend variable is set to zero. The chart below shows the volatility trend indicator compared to VIX during an “interesting” period that includes the 2008/2009 meltdown and the Flash Crash.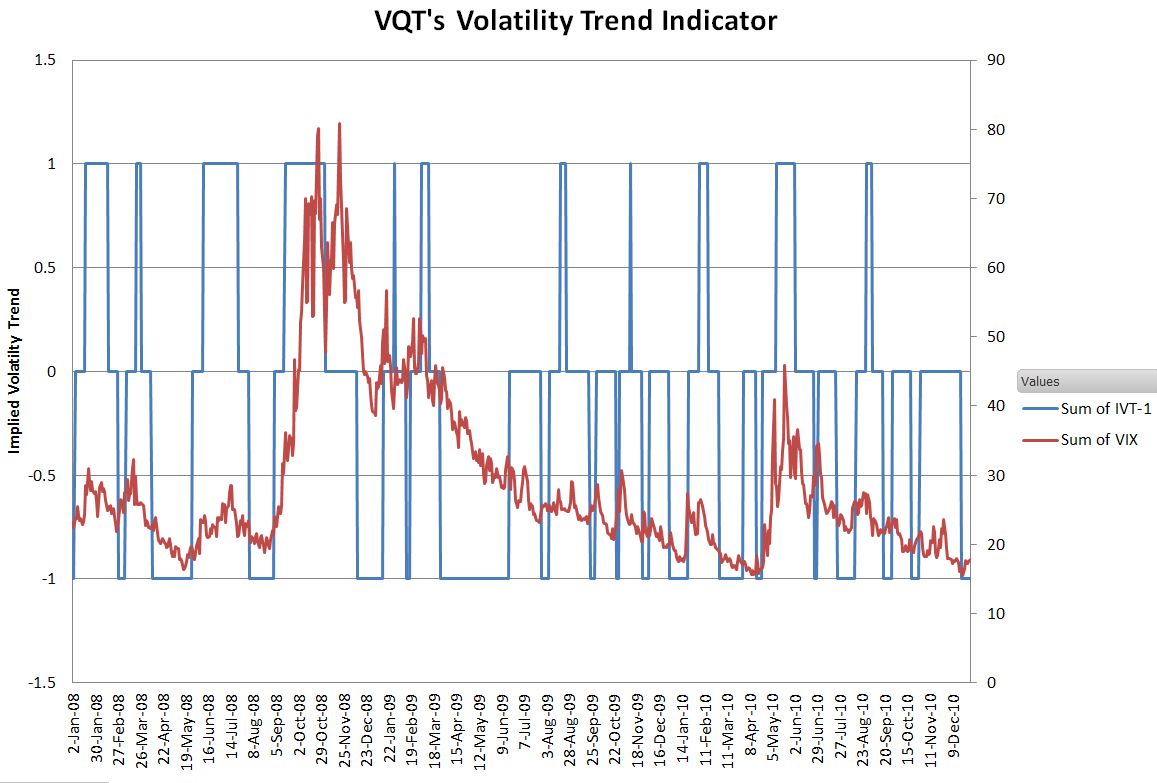
The implied volatility trend is essentially a 3 state version of the VIX index—up, down, or sideways…
The matrix below, taken from Barclays’ prospectus, shows VQT’s non-cash settings determined by S&P 500 realized volatility and VIX trends are shown below.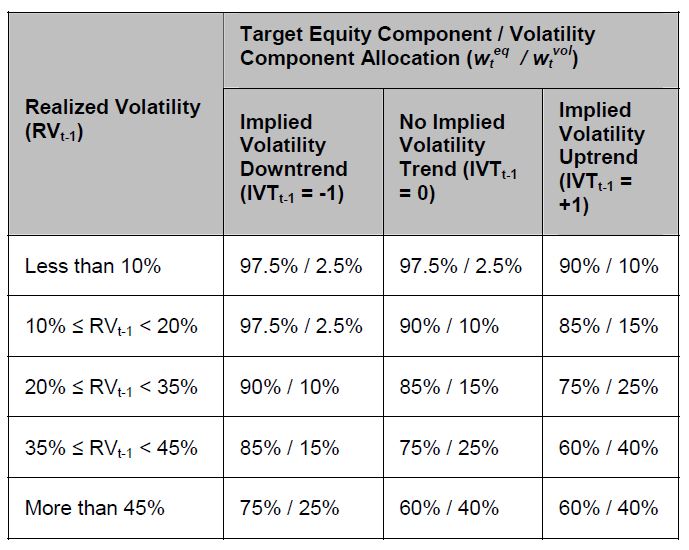
In addition to these settings there is the 100% cash stop loss allocation of VQT, which occurred a surprising 156 times in the eight year span I evaluated—7.5% of the time. The chart below shows that this shift into cash, while most prevalent during the 2008/2009 crash, can occur frequently in both bull and bear markets.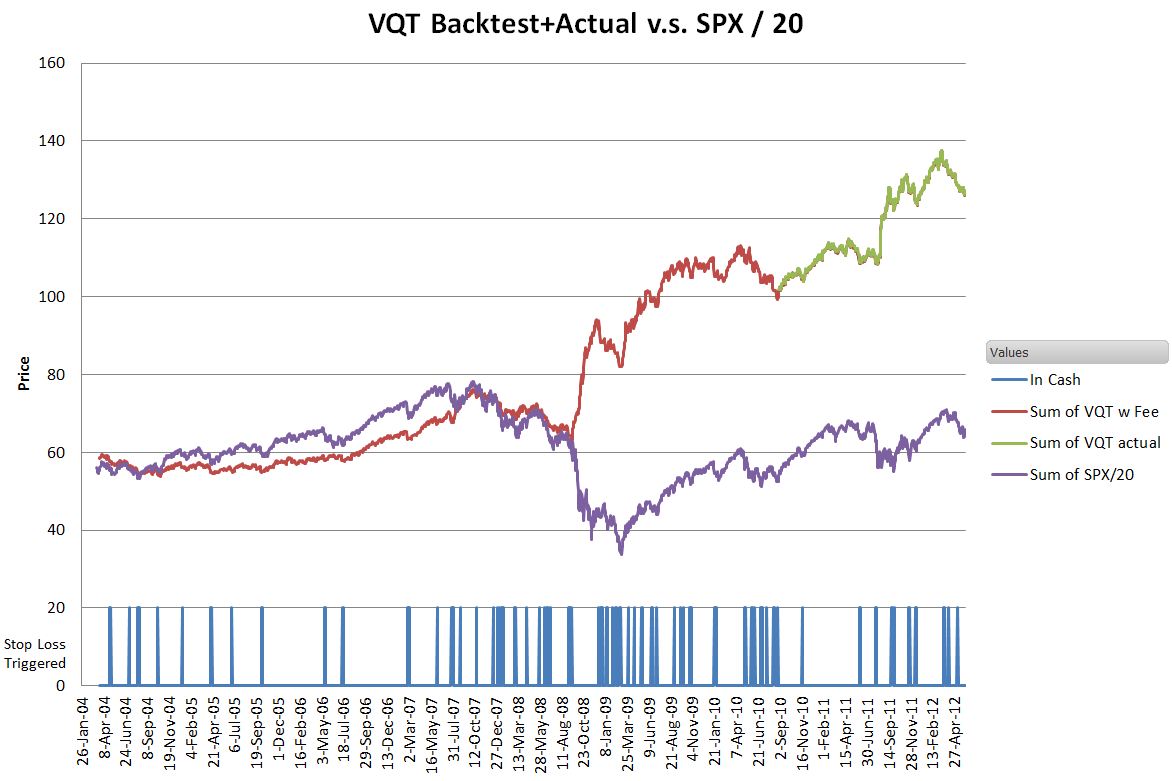
Intuitively there are two scenarios where VQT could fall more than 2%:
- The S&P 500 is falling and the VXX allocation is not big enough or not gaining enough to offset the drop in equities
- Losses in the VXX position pull down the overall value of the fund
My simulation shows the VQT stop loss being triggered 108 days, 2/3rds of the total number, when the S&P 500 was dropping and the volatility trend was flat or increasing—so scenario #1 is the most common.
The stop loss feature makes VQT the best of the hybrid strategy ETNs in reacting to fast volatility spikes. The equity/volatility allocation knobs are tied to SPX and VIX moving averages which are inherently slow to react, but the stop loss feature triggers quickly, moving the fund into cash after a single down day of 2% or more. VQT won’t benefit from the initial spike, but the pause buys time for the allocations to adjust to new market conditions.
Since its inception on August 31, 2010, VQT has performed well in an overall bullish market. It’s roughly tied with S&P 500 with growth rates of 28% vs. 30%, but it sports a maximum drawdown of only 6% vs. 18% for the S&P 500. In the July/August 2011 market correction, when the S&P 500 lost 13%, VQT was up 5%—an impressive performance.
It’s odd when holding a primarily long equity position to hope for a market crash, but with VQT a market panic is not something to be feared.
