News
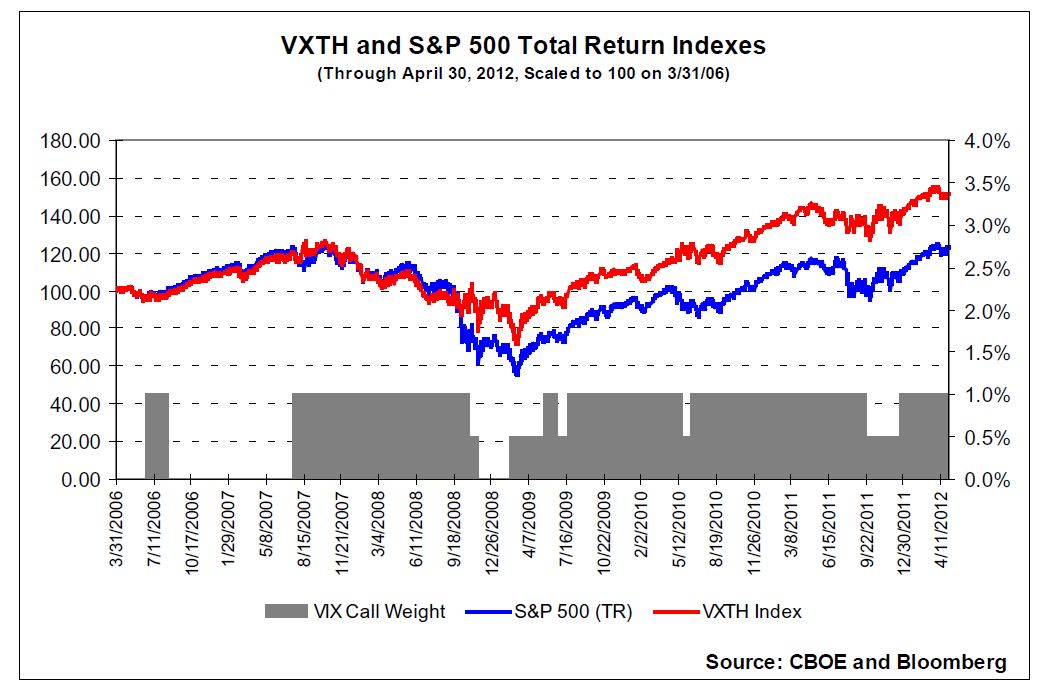
- We have a new USA based Volatility ETP. First Trust’s CBOE S&P 500 Tail Hedge ETF—ticker VIXH broke the drought, bringing us to a grand total of 32 US volatility funds (see Volatility Tickers for the full list). This ETF, based on the CBOE VIX Tail Hedge IndexSM (Bloomberg VXTH:IND) stays completely in the S&P 500 with dividends reinvested unless the front month VIX futures are in the 15 to 50 range. Within that range it buys front month OTM (30 delta) VIX calls on the rebalancing day—which happens to be the expiration date of the previous front month options. The historical chart of the CBOE index is shown below:

- My initial impression of VIXH is that the 40% drawdown in the 2008/2009 crash is not impressive for a Tail Risk fund. In the 3 years since the crash, its index has climbed to a 30% advantage over a S&P only strategy—not bad, but anemic compared to its nearest competitor Barclays’ VQT, whose index turned in a nearly 100% gain over the same period. But what surprises me the most about this fund is its once per month rebalancing. In the wild world of volatility a month is an eternity, but VIXH opts for the convenience of managing VIX options on their expiration dates.
- Proshares’ UVXY decided to do a 10:1 reverse split instead of the 6:1 I predicted a while back. Good for them, no sense in having to reverse split these adrenaline monsters more often than necessary. The 2X leveraged short term volatility funds tend to lose around 90% of their value per year, so we probably won’t be seeing another reverse split for UVXY until about this time next year.
- Dollar inflows into the volatility funds have been high—I suspect spurred by 5 year lows in the VIX index. The CBOE has been issuing press releases about record levels of open interest for VIX futures, but so far Barclays’ hasn’t trumpeted the fact that their flagship VXX fund recently touched the $2 billion mark in assets under management—which I’m pretty sure is a record for them. Proshares’s UVXY has been pulling in funds too, with $640 million in 2012 inflows (less than $290 million of that remains as assets under management)
- Apparently Barclays is going to wait until VXX drops into single digits before it does its 4:1 reverse split. We won’t have too long to wait…
- I continue to think Credit Suisse will allow TVIX to fade to black. Its volume and assets ($225 million under management) are fading as it sags toward $2.
- While the short term end of the VIX Futures term structure is staying within historic ranges the mid-term 4 to 7 month ranges are not. The typical, non panicky shape of the term structure has shifted from a decaying exponential shape to a relatively straight line. The result is record high contango on the mid-term VIX futures. The same effect seems to be happening on at least the 3 month portion of the VIX term structure curve. While it is really tough to prove what has caused this shift I wouldn’t be surprised if the increased open interest in mid-term VIX futures was one of the driving factors.
