Unless you’ve been living under a rock, you know that stock markets around the world suffered a major blow on Monday.
All three major U.S. indices ended the day in full-blown correction territory.
The Chicago Board Options Exchange Volatility Index which measures CBOE call volume and is also known as the market’s “fear gauge,” spiked above 50 for the first time since 2009.
Now, it’s far too early to say whether we’ve seen the bottom or not. But the outlook isn’t as grim as you might think.
What’s more, the worst thing to do on a day like Monday is sell. Believe me, the investors making real money are those buying the dips. It’s a tough concept for some people to get their minds around, but corrections provide some of the most rewarding opportunities.
And if you think you’ve missed your chance to buy some stocks on the cheap, you’re dead wrong. Using one powerful technical indicator, you can trade this volatile market like a pro for weeks to come.
I’m talking about the Relative Strength Index (RSI), which is one of the most useful technical indicators out there. Its value is enhanced even further during times of intense market volatility.
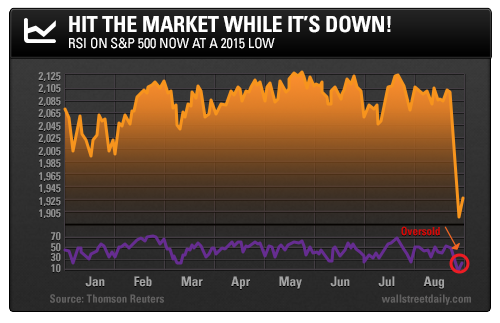
RSI measures a stock’s momentum using a simple formula that determines strength or weakness and grades on a scale from 0 to 100. When you hear an analyst talking about a stock being “oversold” or “overbought,” they’re probably referring to RSI.
Typically, a reading below 30 indicates a stock is oversold and a reading above 70 means a stock is overbought. As of Tuesday’s open, 80% of the S&P 500’s constituents were oversold. The Index itself had an RSI reading of 28.
Buying a stock you want when it’s oversold can be the difference between paltry returns and super-charged gains. Let’s take a look at an example.
The last time the Dow Jones Industrial Average (DJIA) fell below 16,000 points was in October 2014. You’ll recall that was the height of the Ebola scare, and airline stocks took a huge hit.15% in Two Weeks Thanks to RSI
Despite a major operational restructuring and strong early year performance, Southwest Airlines Company (NYSE:LUV) wasn’t spared. It fell 18% last October from its all-time high just one month prior. The stock’s RSI fell from 90 (extremely overbought) to 15 (extremely oversold) in the blink of an eye.
So how could a savvy investor have played this selloff opportunity on a red-hot stock using RSI?
The most efficient way to use RSI is to buy when the stock price crosses back above 30 – the oversold threshold. This RSI cross implies that a stock’s momentum has swung back to the upside.
Using this example, RSI on Southwest crossed above 30 on October 13. Just a few weeks later, shares shot back up to $34.59, and the stock’s RSI crossed above 70, implying overbought conditions.
Once Southwest became overbought, you could’ve sold shares when the RSI fell back to 70 and bagged an easy 15%. Or, you could’ve ridden them through the end of the year to a 41% gain.

Now’s the Time to Make Your Move
Right now, the market is showing an even juicier opportunity than last year’s Ebola dip.
Of course, there’s always a chance that things could get worse before they get better. But it’s safe to say that after Tuesday’s pop, bullish sentiment is alive and well in this market. The smart money is buying stocks from their watch list and gearing up for the inevitable oversold bounce in the broad market.
Using RSI, you can do the same and take advantage of this volatile market.
On the hunt,