In a world of high-frequency trading, central bank rate manipulation and cross-border fund flows, fundamental value often gets pushed to the back burner. Without question, U.S. stocks are very expensive — inordinately overpriced. Nevertheless, most will opt to continue placing their faith and their hard-earned dollars in what they know.
Can one pursue reasonably priced equities in regions where the economies are growing at a rapid clip? Guggenheim Frontier Markets (NYSE:FRN) allows investors to tap Latin America, while Market Vectors Gulf States (MES) permits access to the Middle East. Still, concerns about Argentina debt may frighten off prospective frontier enthusiasts; unrest in Iraq and Syria might thwart demand for exposure to companies around the Persian Gulf.
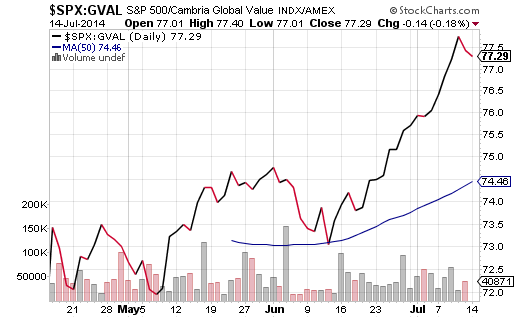
Similarly, one could adopt an approach where he/she would only pay for the biggest bargains from the world’s developed and developing markets. The deep discount strategy certainly has back-tested data in its corner; it even has a popular new ETF a la Cambria Global Value (GVAL). Once again, though, the typical 2014 investor is riding the momentum of the moment. The 3-month price ratio between the S&P 500 and GVAL (SPX:GVAL) demonstrates just how much the winds are currently favoring the overpriced benchmark.
The simple fact is that fundamental valuation matters little in late-stage bulls. Consider recent data provided by Ned Davis Research. There have been 35 bull-market peaks since 1900. Each peak has a price-to-sales (P/S) ratio, a price-to-book (P/B) ratio and a cyclically adjusted price-to earnings (P/E 10) ratio. U.S. stocks are more expensive than 89% of previous bull market peaks based upon revenue/sales, 82% of prior peaks based upon book value and 86% of bull market tops based upon 10 years of profits.
In spite of tried-and-true metrics at our fingertips and on our computer screens, the media tend to reinforce the collective exuberance. Employment gains are booming, they say. Really? Inflation-adjusted median income has dropped over the last five years, more people are leaving the workforce than joining it, the bulk of new job gains are part-time and millions are woefully under-employed. The economy is rocketing, they maintain. Honestly? The U.S. grew at 2.8% in 2012, 1.9% in 2013 and we’d need to see three consecutive quarters of 3%-plus GDP for the final three quarters of 2014 to avoid another year of economic deceleration.
There is one thing that the media have gotten correct. The wealthy have been getting wealthier – myself included – due to the zero percent interest rate policies of central banks like the U.S. Federal Reserve. The Fed’s determination to inspire borrowing by consumers and by businesses has reflated stock and real estate assets. Indeed, wealthier folks own more stocks and own more real estate than less wealthy families.
The market is tethered more tightly to central bank maneuvering than it is to any other variable. Certainly more than corporate sales and/or corporate earnings. Understanding that it will be difficult to pin-point the moves of influential central banks — the Fed, the Bank of England, the Bank of Japan, the European Central Bank — implies that one can neither ignore overvalued U.S. stocks nor abandon them. It also means that stock hedges from the risk-free Treasury camp also deserve portfolio consideration.
For example, low volatility U.S. stocks are appropriate for new money seeking a home stateside. I favor iShares MSCI USA Minimum Volatility (USMV). You may not be able to win the valuation game in the U.S., but you may be able to curb the price fluctuation. I might also look for better valuation prospects overseas, whether it comes from the deep discount bin with Cambria Global Value (GVAL) or the re-emerging Asian markets via iShares MSCI Asia excl Japan (AAXJ). These are the types of risk assets that make up the right-hand side of my barbell approach.
On the left side? Long-dated Treasuries via funds like PIMCO Inflation Protected 15 Year Plus (LTPZ) and Vanguard Extended Duration (EDV). You may convince yourself that rates are going to spike, but the demand for the long end of the curve still has plenty of legs.
Disclosure: Gary Gordon, MS, CFP is the president of Pacific Park Financial, Inc., a Registered Investment Adviser with the SEC. Gary Gordon, Pacific Park Financial, Inc, and/or its clients may hold positions in the ETFs, mutual funds, and/or any investment asset mentioned above. The commentary does not constitute individualized investment advice. The opinions offered herein are not personalized recommendations to buy, sell or hold securities. At times, issuers of exchange-traded products compensate Pacific Park Financial, Inc. or its subsidiaries for advertising at the ETF Expert web site. ETF Expert content is created independently of any advertising relationships.

