As several leading domestic stock indexes reach new highs, the vast majority of Wall Street analysts are increasing their bullish calls. Riding a wave of aggressive government stimulus and the promise of more, stock prices have risen aggressively since November. Investors apparently trust that the Fed will prevent any significant market declines. Clearly, momentum is powerful, and more people jumping on the bandwagon could keep the rally going. At the same time, it’s important to recognize that, notwithstanding analyst contentions to the contrary, stocks are extremely expensive relative to long-term historic guidelines.
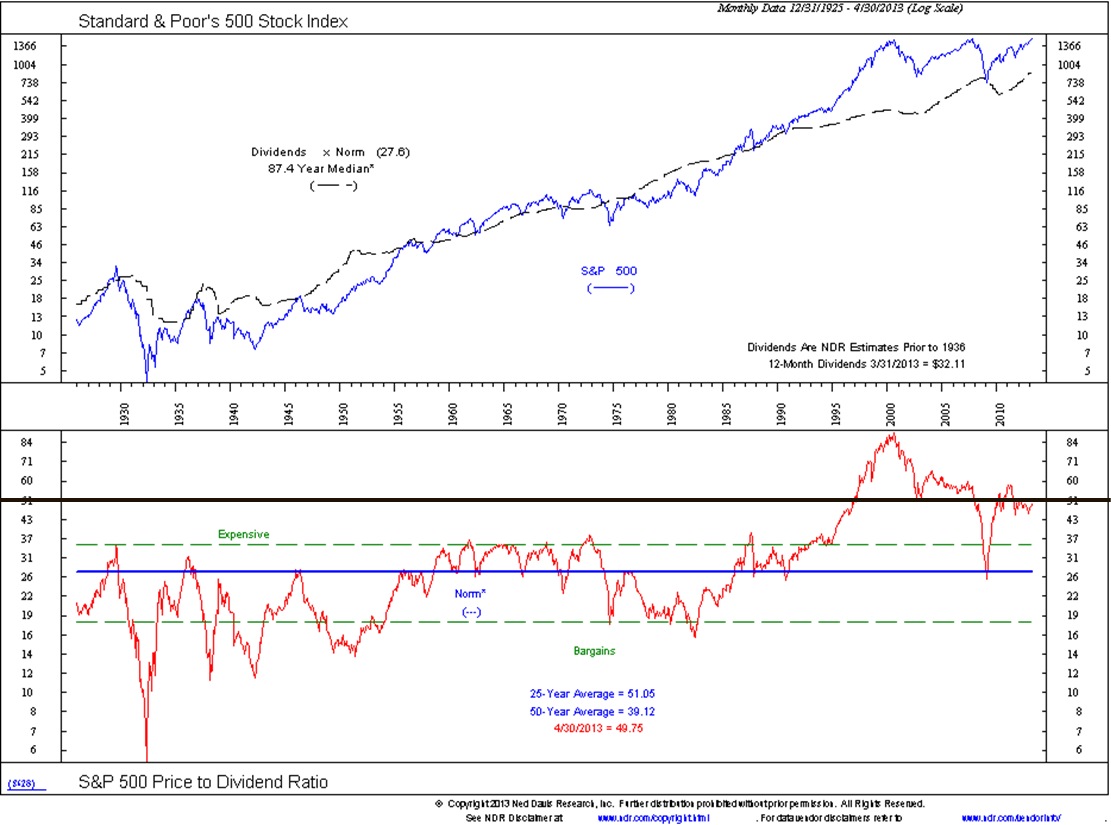
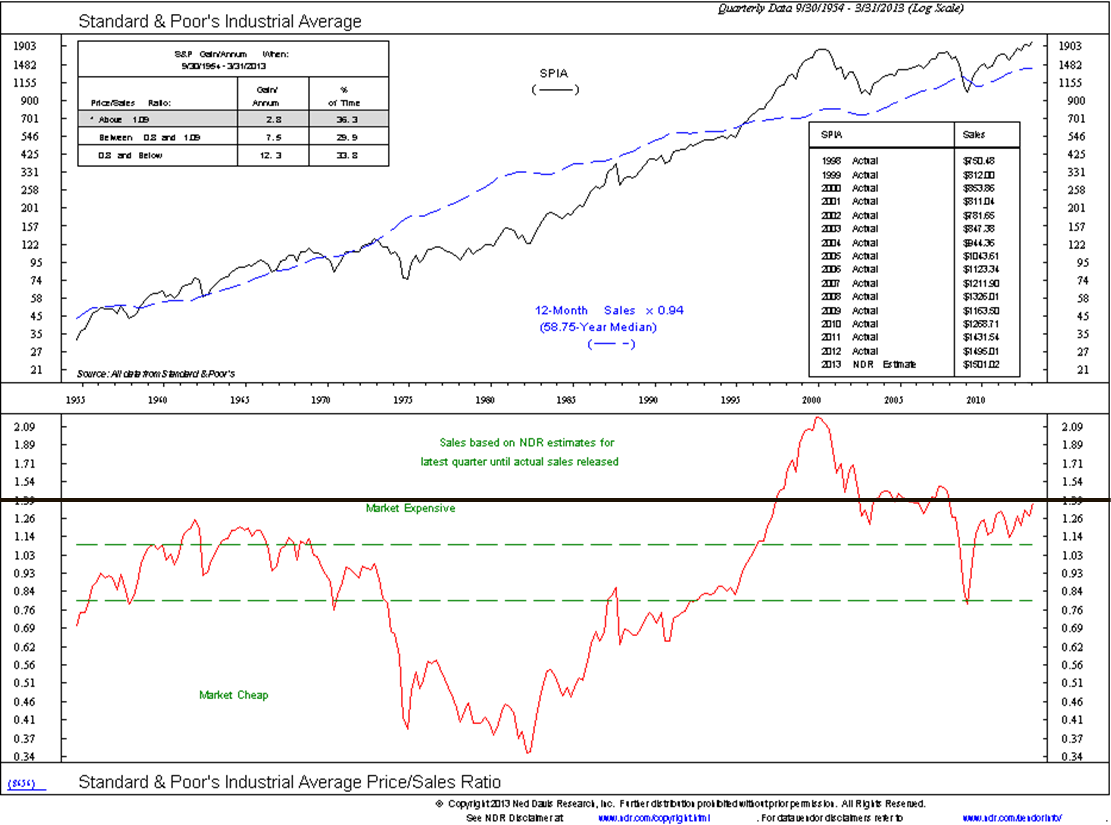
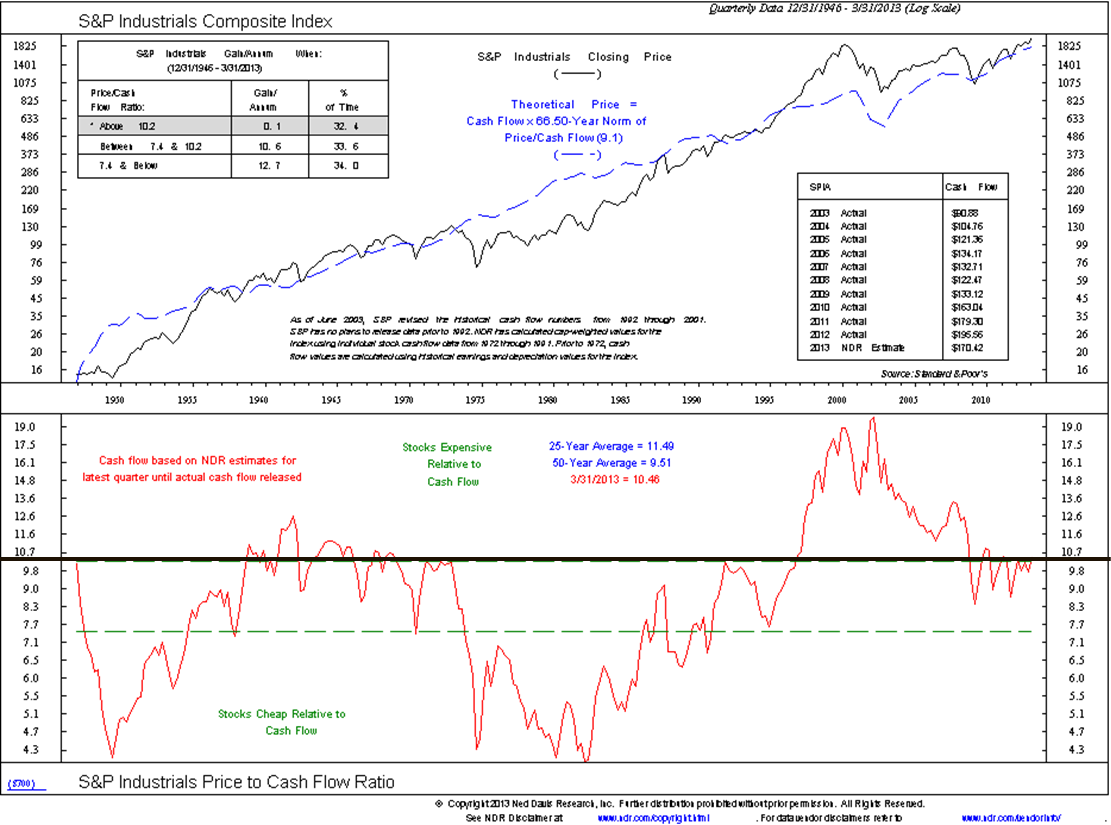
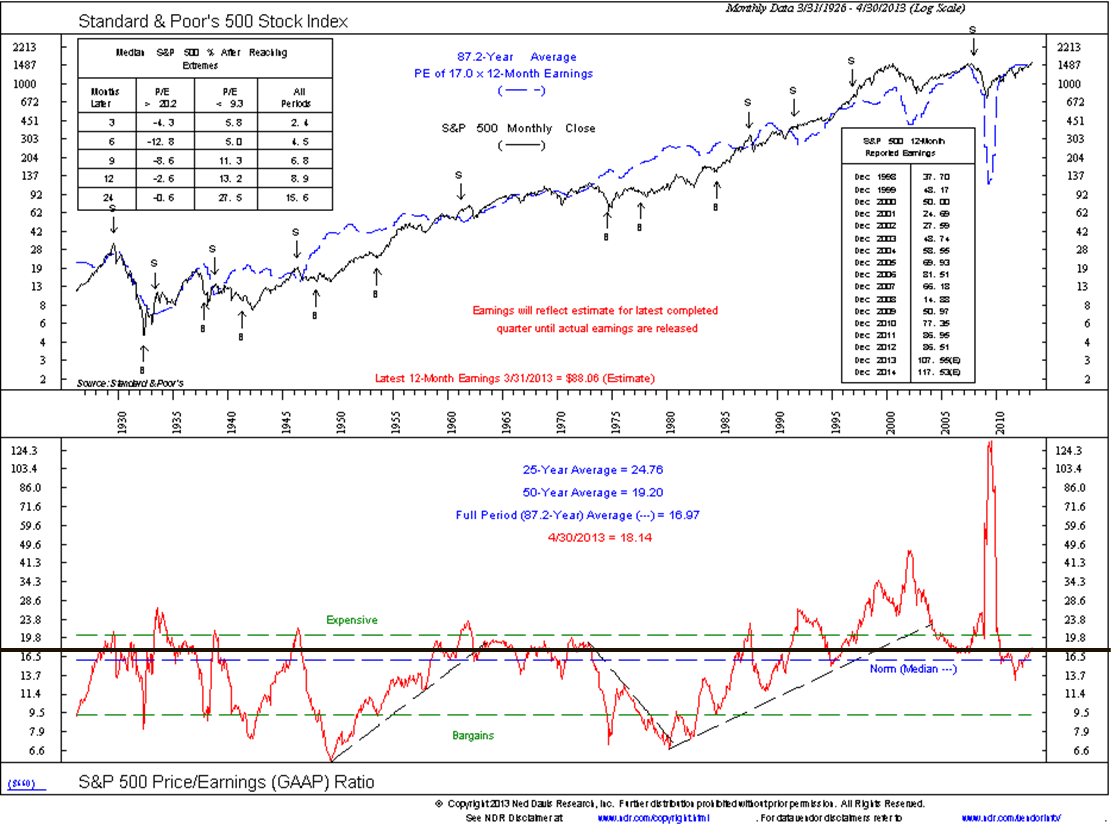
At Thursday’s client conference, I presented the following valuation graphs produced by the excellent Ned David Research staff. The bottom half of each graph traces a valuation ratio over a period of many decades. In sequence, these ratios measure Price-to-Book Value, Price-to-Dividends, Price-to-Sales, Price-to-Cash Flow and Price-to-Earnings. On each, we have drawn a solid line across the full expanse of time from the valuation ratio’s level at the end of April. The first four graphs show the current valuation line intersecting the ratios in the period from the late 1990s into the first years of the present century and very little else as far back as the graph covers.
In other words, by each of these measures, stocks are more overvalued today than at virtually any point but during the recent bubble period that resulted in the 50% decline from 2000 to 2003 and the even more severe 57% decline from 2007 to 2009. That includes the stock market peaks in 1929 and 1973, which preceded declines of 89% and 45%, respectively. The fifth graph shows Price-to-Earnings as less egregiously overvalued, although above average. Earnings, however, can be more easily manipulated and controlled than book value, dividends, sales and cash flow. In the aggregate, stocks are extremely overvalued.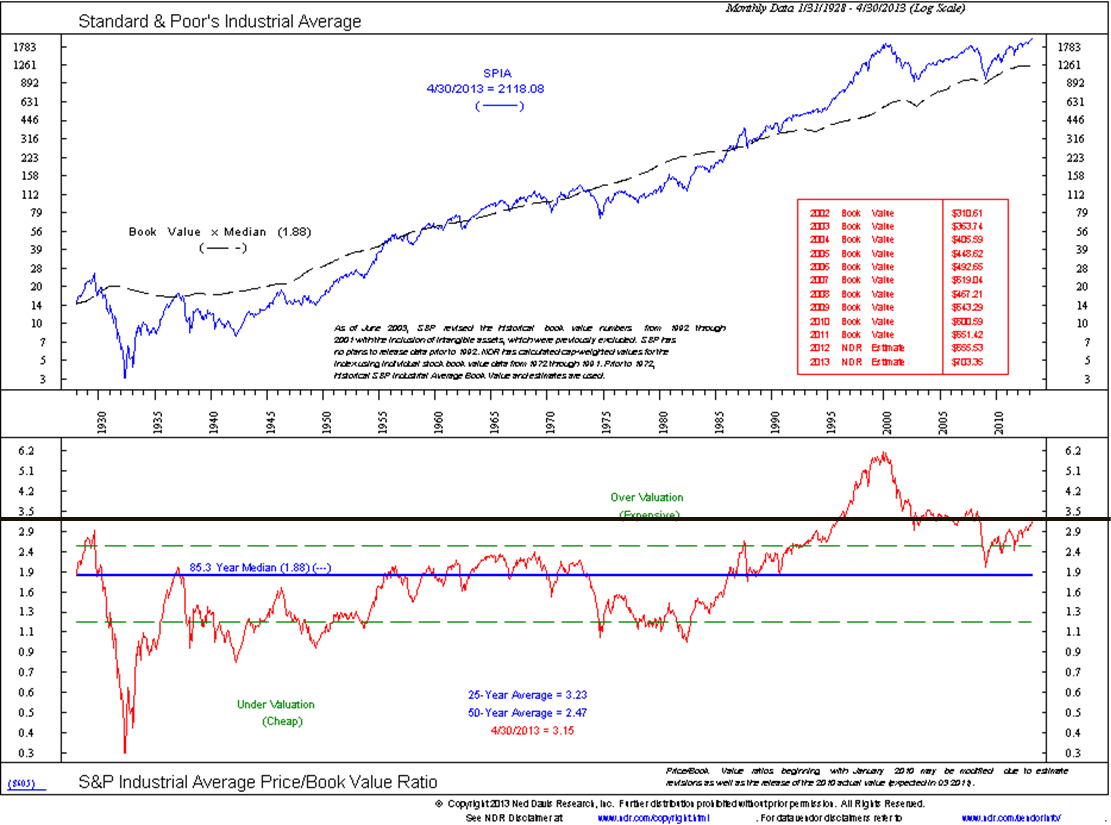
The following graph shows valuation in a different manner. As with the preceding graphs, it depicts a ratio, the value of all common stocks compared to the size of the economy. Today’s reading is less extreme than that in 2000 and slightly less than that in 2007. It is far above, however, all other readings back to the mid-1920s, including the peaks in 1929 and 1973.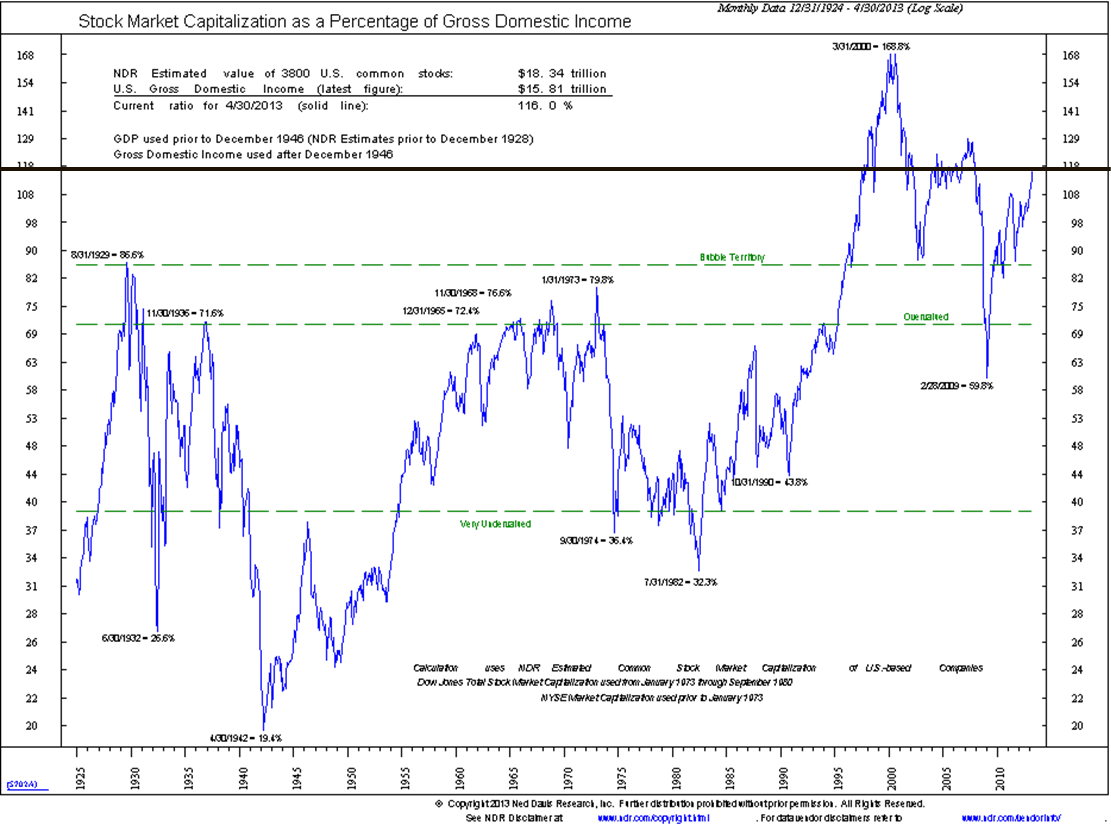
Comparing U.S. valuations, as measured by Dividend Yield and Price-to-Earnings, -Cash Flow and -Book Value, with other major world stock markets shows the U.S. more overvalued in the aggregate than Japan, France, the United Kingdom, Germany, Canada and Australia.
On the following graph, we have again drawn a solid line at the U.S. level for each measure across the full spectrum of the other countries.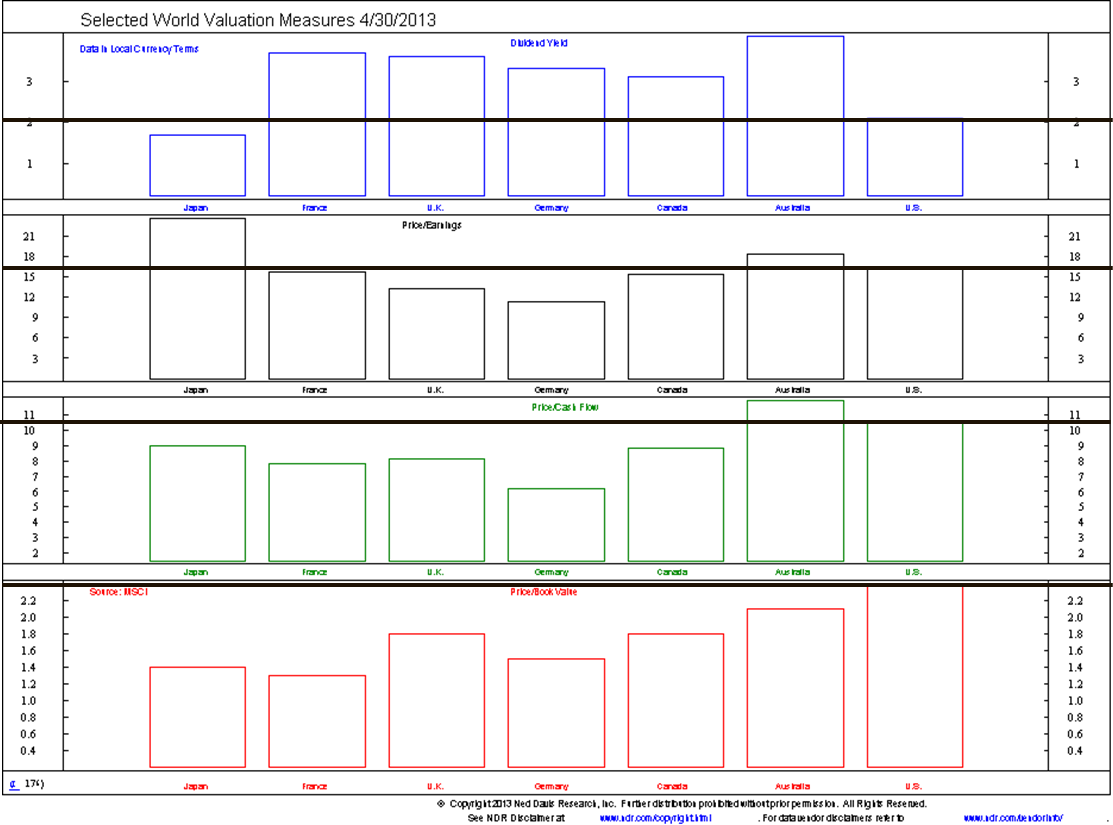
For dividend yield, which we prefer to be high, the U.S. is the second lowest. We prefer Price-to-Earnings, -Cash Flow and -Book Value to be low. In descending order, the U.S. is the third, second and first highest for those valuations. In aggregate, the U.S. is more overvalued than any of the other six countries.
By itself, excess valuation does not preclude further price advances. It does, however, leave a stock market more vulnerable to other negative factors that influence prices. In the current environment, in which debt and solvency questions persist in many countries and banking systems, excess valuation raises the risk level for stock ownership.
- English (UK)
- English (India)
- English (Canada)
- English (Australia)
- English (South Africa)
- English (Philippines)
- English (Nigeria)
- Deutsch
- Español (España)
- Español (México)
- Français
- Italiano
- Nederlands
- Português (Portugal)
- Polski
- Português (Brasil)
- Русский
- Türkçe
- العربية
- Ελληνικά
- Svenska
- Suomi
- עברית
- 日本語
- 한국어
- 简体中文
- 繁體中文
- Bahasa Indonesia
- Bahasa Melayu
- ไทย
- Tiếng Việt
- हिंदी
Valuation Update: Stocks Currently Overvalued
Published 05/07/2013, 01:55 AM
Updated 07/09/2023, 06:31 AM
Valuation Update: Stocks Currently Overvalued
3rd party Ad. Not an offer or recommendation by Investing.com. See disclosure here or
remove ads
.
Latest comments
Install Our App
Risk Disclosure: Trading in financial instruments and/or cryptocurrencies involves high risks including the risk of losing some, or all, of your investment amount, and may not be suitable for all investors. Prices of cryptocurrencies are extremely volatile and may be affected by external factors such as financial, regulatory or political events. Trading on margin increases the financial risks.
Before deciding to trade in financial instrument or cryptocurrencies you should be fully informed of the risks and costs associated with trading the financial markets, carefully consider your investment objectives, level of experience, and risk appetite, and seek professional advice where needed.
Fusion Media would like to remind you that the data contained in this website is not necessarily real-time nor accurate. The data and prices on the website are not necessarily provided by any market or exchange, but may be provided by market makers, and so prices may not be accurate and may differ from the actual price at any given market, meaning prices are indicative and not appropriate for trading purposes. Fusion Media and any provider of the data contained in this website will not accept liability for any loss or damage as a result of your trading, or your reliance on the information contained within this website.
It is prohibited to use, store, reproduce, display, modify, transmit or distribute the data contained in this website without the explicit prior written permission of Fusion Media and/or the data provider. All intellectual property rights are reserved by the providers and/or the exchange providing the data contained in this website.
Fusion Media may be compensated by the advertisers that appear on the website, based on your interaction with the advertisements or advertisers.
© 2007-2024 - Fusion Media Limited. All Rights Reserved.
