
Investors run from volatility, while traders embrace periods where price variance increases. The natural gas futures market has been ground zero for traders in search of volatile price action since the energy commodity began trading on the NYMEX division of the CME in 1990. Since then, the price has traded to a low of $1.02 and a high of $15.65 per MMBtu. The market has evolved over the past three decades. Both the supply and the demand side of the fundamental equation expanded.
Massive discoveries of natural gas reserves in the Marcellus and Utica shale regions of the United States combined with technological advances in extracting the gas from the crust of the earth created a tidal wave of supplies. Replacing coal with natural gas in power generation and the liquification of gas for export to other countries worldwide have created new demand verticals.
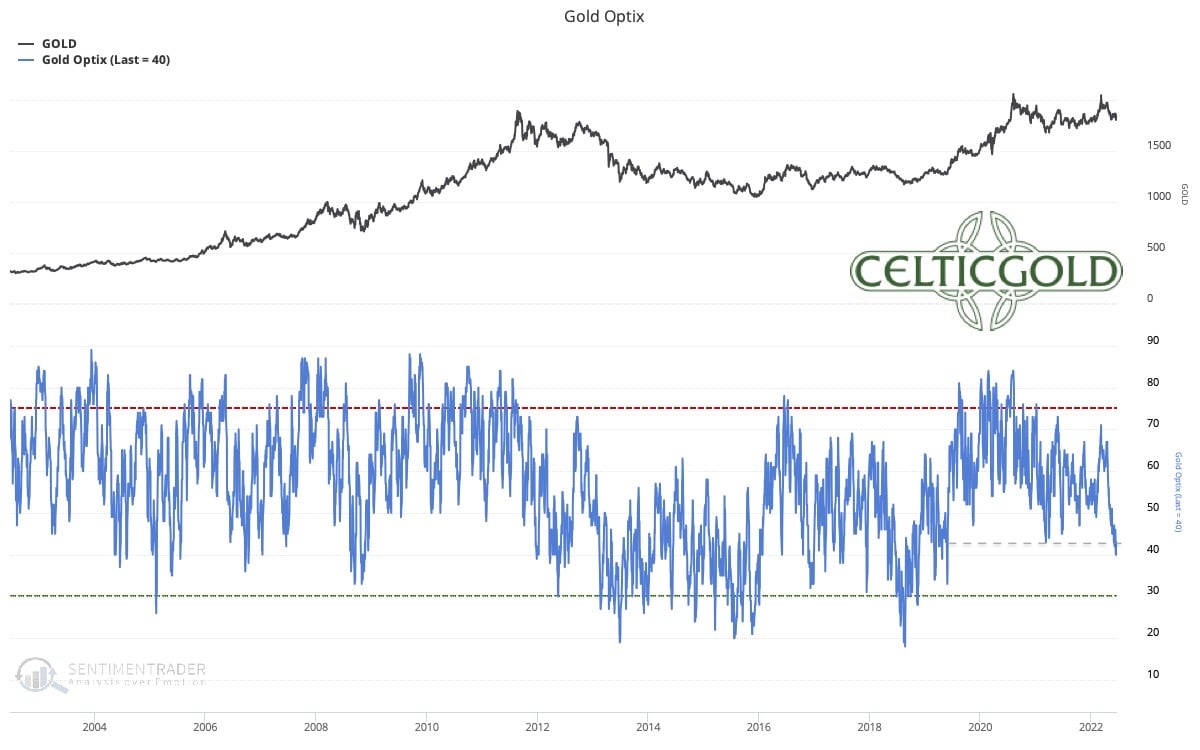
In late March, the price of natural gas fell to its lowest level in two-and-a-half decades, when the price reached $1.519 per MMBtu. After a recovery that took the price to a high of $2.162 in early May, the price briefly slipped to just below the $1.60 level on May 13. Since then, the price recovered and was below the $1.75 per MMBtu level at the end of last week. The United States Natural Gas Fund (NYSE:UNG) is the unleveraged product that follows the price of the futures on NYMEX higher and lower. Many market participants prefer the triple leveraged UGAZ and DGAZ instruments as they turbo-charge bullish and bearish price action in the short term.
In late March, the price of natural gas fell to its lowest level since 1995, when it reached a bottom at $1.519 per MMBtu.
(Source: CQG)
As the weekly chart highlights, nearby natural gas futures have made marginally higher lows since the quarter-of-a-century bottom. During the week of March 30, the low was at $1.521. In mid-April, natural gas bounced off $1.555. Last that month, the low was at $1.593, and in mid-May, $1.595 was the low.
Price momentum and relative strength metrics were below neutral territory at the end of last week. Open interest at 1.259 million contracts is near last year’s level. Meanwhile, weekly historical volatility at around 56% is near the highest level of the year, and significantly above the level in late May 2019. The recent move to a high of $2.162 on May 5 caused weekly trading ranges to widen.
A lower high could be on the horizon
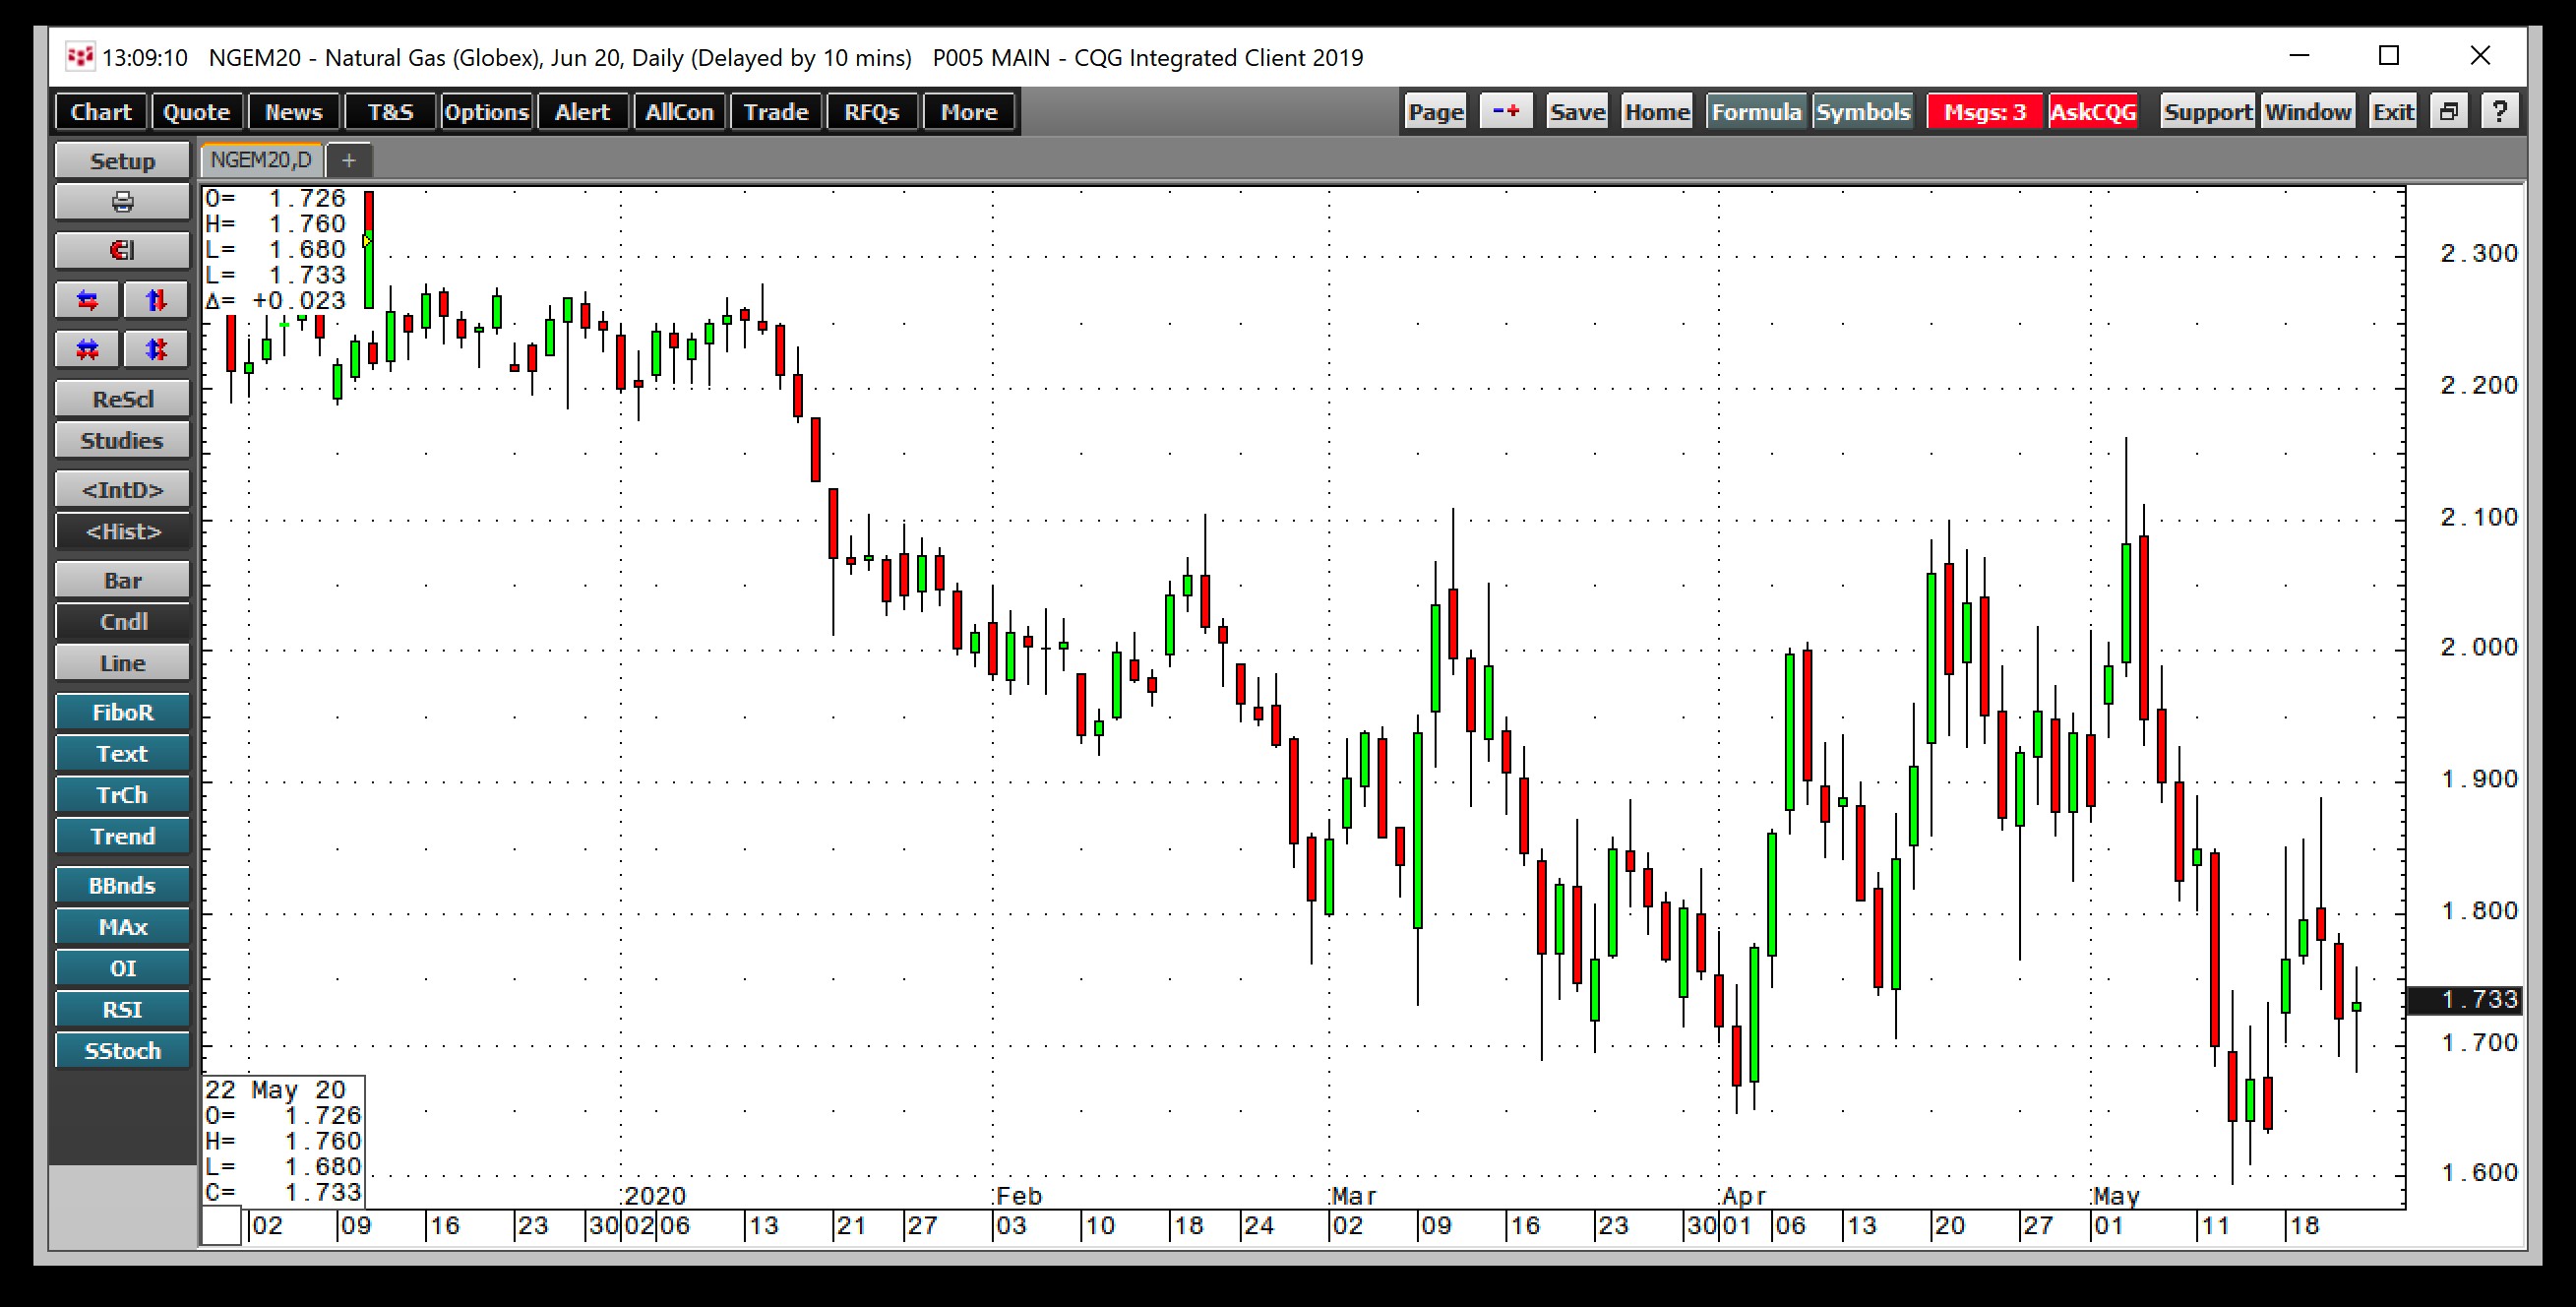
Natural gas moved to a level on the upside that turned out to be a false breakout when the price reached $2.162 per MMBtu in early May.
(Source: CQG)
The daily chart illustrates the decline from the May 5 high to a low of $1.595 on May 13, a slump of 26.2% in a little over one week. The midpoint of the recent high and low stands at $1.879 per MMBtu. Last week, the price rose to a high of $1.889, where it failed and fell back below the $1.70 level before recovering slightly at the end of the week. The $1.88 level could now stand as a short-term pivot point for the natural gas futures market on the June contract, which is rolling to July.
Contango or the forward premium make the pivot point on July futures higher.
Trading The Range In The Natural Gas Market
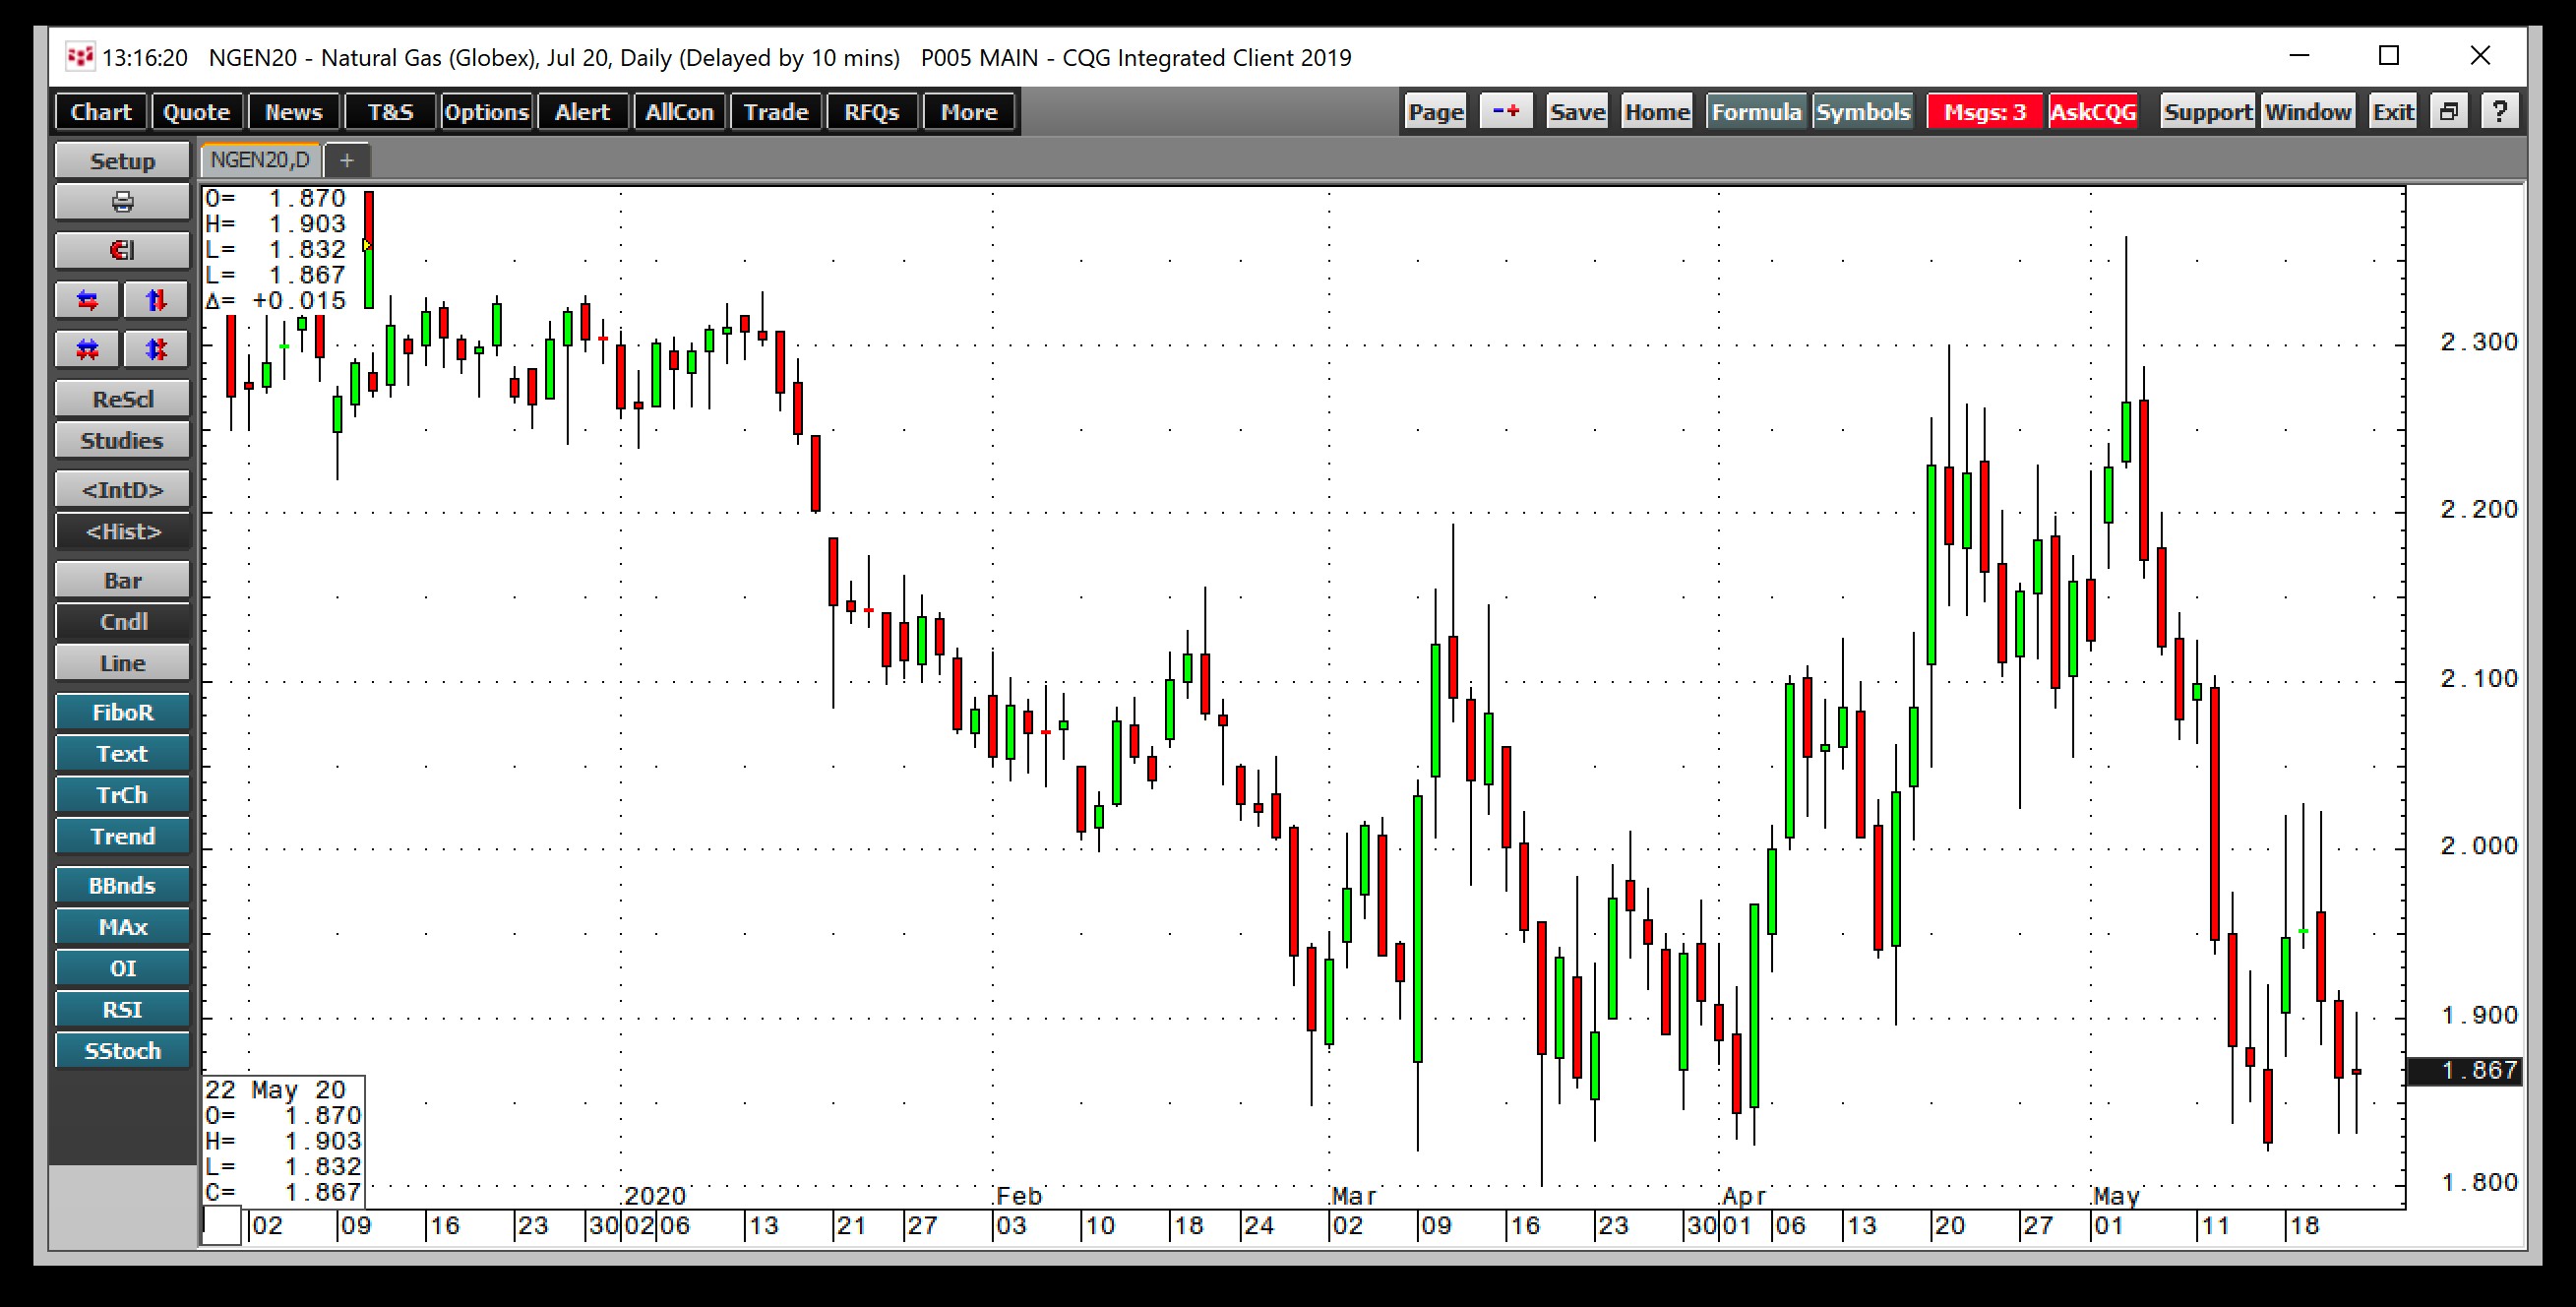
With July futures becoming the active month, natural gas is now shifting into summer mode, where the demand for air conditioning rises. Since natural gas powers electricity generation, the July contract trades at a premium to June.
(Source: CQG)
The July contract shows that the range was from $2.364 to $1.822, with a midpoint of $2.093 per MMBtu. The July contract was trading below the $1.900 level at the end of last week.
If natural gas is going to settle into a trading range with higher lows and lower highs over the coming weeks, buying natural gas below $2 and selling when the price is above $2.10 using a scale-down, and scale-up approach could be the optimal approach to the volatile market.