
USD/JPY reached its higher level so far in 2019 yesterday. The pair climbed to 112.166, extending its recovery from the 109.71 bottom formed last month.
But the bulls didn’t always look that confident. Just a week ago, the pair was hovering around 111.15, down from 111.83 five days earlier. Instead of forming an opinion based on extrapolating the most recent price action into the future, we turned to the Elliott Wave Principle.
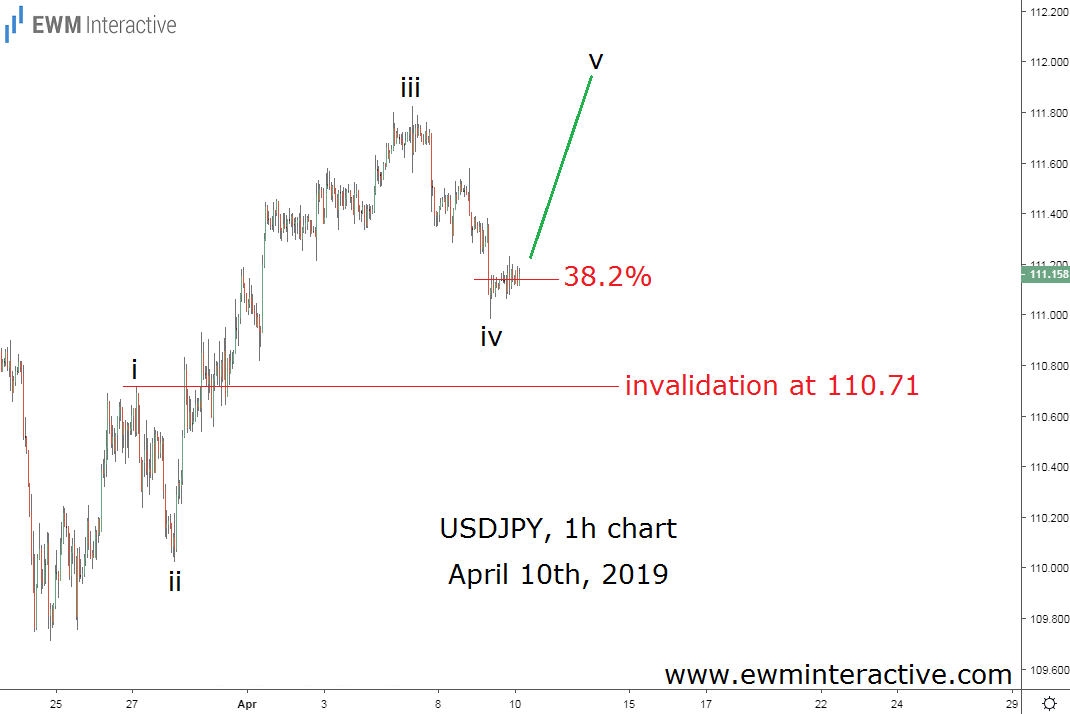
Having the big picture outlook in mind, the hourly price chart of USD/JPY made us think a five-wave impulse is in progress. Waves i through iv were already in place, but the fifth wave was still missing.
According to one of the Wave principle basic rules, the first and the fourth wave in an impulse cannot overlap. In USDJPY’s case, this meant that as long as the rate was above the top of wave i at 110.71, higher levels in wave v can be expected.
In addition, the pair had already fell to the 38.2% Fibonacci level, which is where fourth waves often terminate. If this analysis was correct, a bullish reversal was about to follow. Targets above 112.00 were very likely.
And that’s about everything traders can do. We can analyze the situation, in order to form an informed opinion. We can prepare for a negative outcome by identifying an invalidation level to tell us when we are wrong. And that’s it.
The third part of the equation – the potential profit or loss – is not in our power. Even the best analyst armed with the best tools and methods is not guaranteed profits. Once we’ve done our job, we simply have to let the market decide. Fortunately, the decision was in our favor.
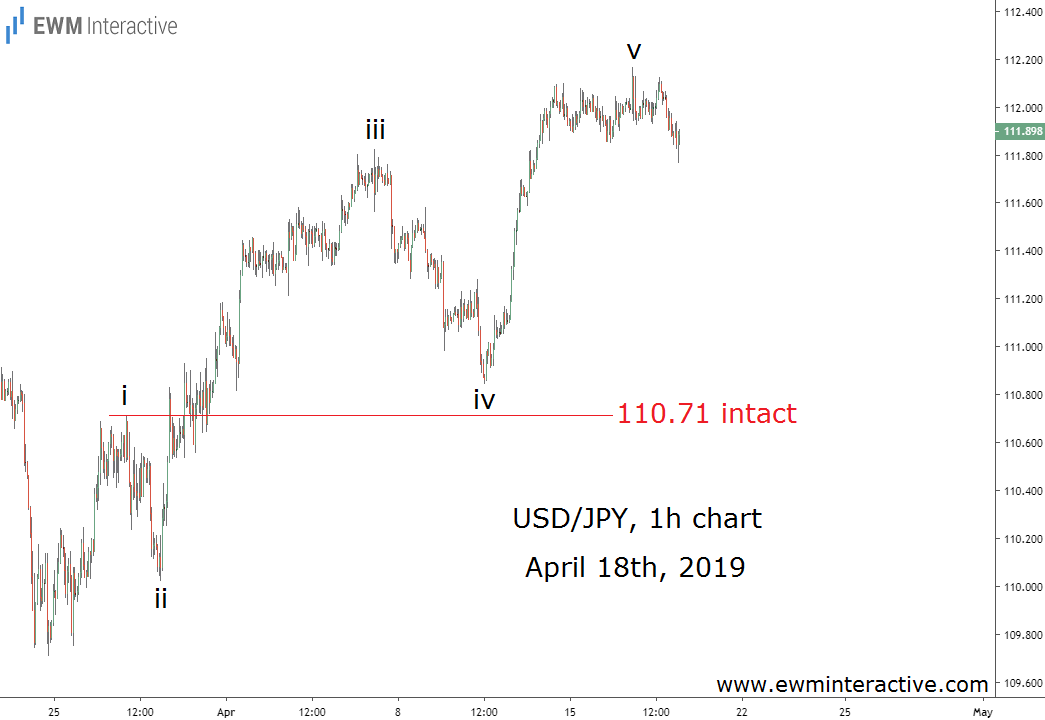
The 38.2% Fibonacci level didn’t give the start of wave v up as USD/JPY fell to 110.84. Nevertheless, 110.71 was never breached and the positive outlook survived. A week later, the pair was trading more than 100 pips higher.