Between 2000 and 2016, USD/CAD and crude oil had a negative correlation in 93% of the time. Canada is one of the world’s biggest oil producers and the largest oil supplier to the United States. So, when U.S. demand for oil rises, demand for Canadian dollars rises, as well, thus hurting the USD/CAD exchange rate. In the opposite case, as oil demand decline, demand for Canada’s currency also falls. So in general, USD/CAD and crude oil prices are supposed to move in opposite directions.
And most of the time they do, but not this week. During the last several days, the price of a barrel of WTI crude oil climbed from a low at $60.79 on Thursday to as high as $63.06 today. Meanwhile, USD/CAD added over 200 pips after it rose from 1.2555 on Monday to 1.2759 on Thursday.
Now, if you are wondering why did USD/CAD and crude oil rise together, we will have to disappoint you, since we are just as clueless about the fundamental reasons for this sudden positive correlation between the two. Fortunately, if you are an Elliott Wave analyst, not knowing why something would happen does not mean you cannot be prepared for it. The rest of the article shows how the Elliott Wave principle put us ahead of the rally in both USD/CAD and crude oil, which were otherwise supposed to move in opposite directions.
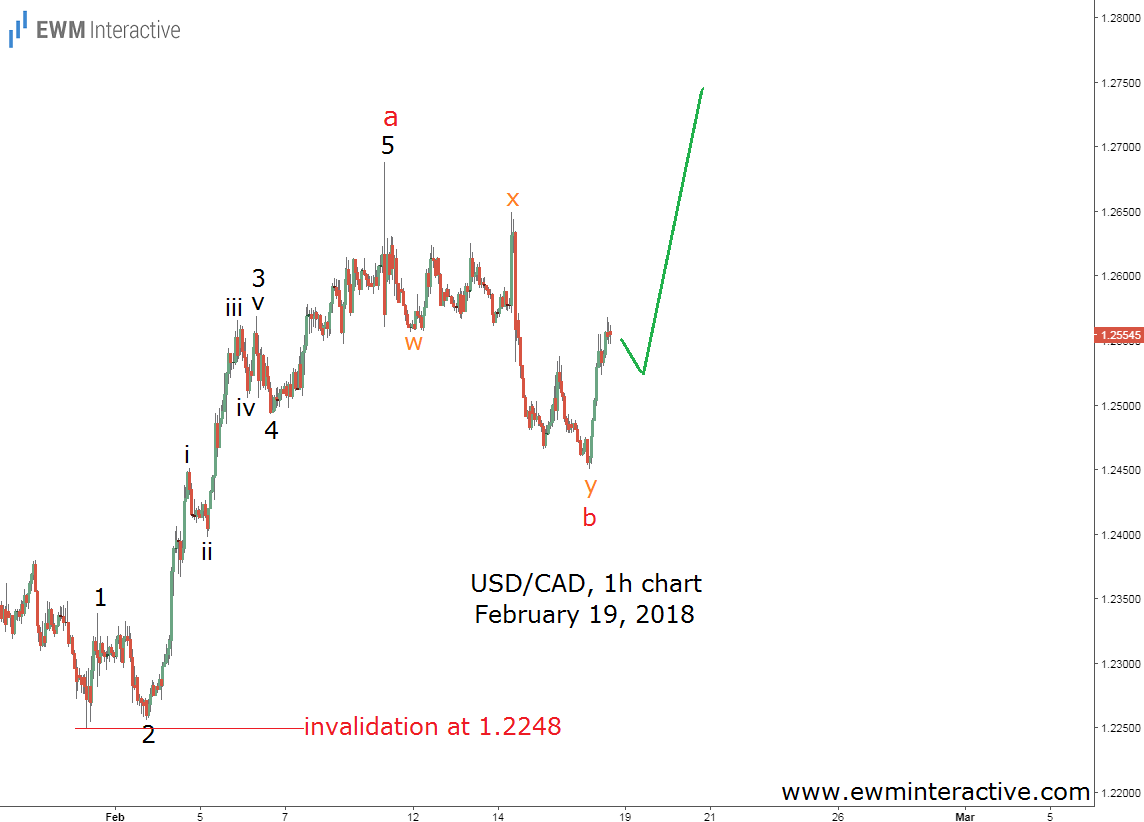
Let’s take USD/CAD first. The chart below was sent to subscribers before the open on Monday, February 19th.
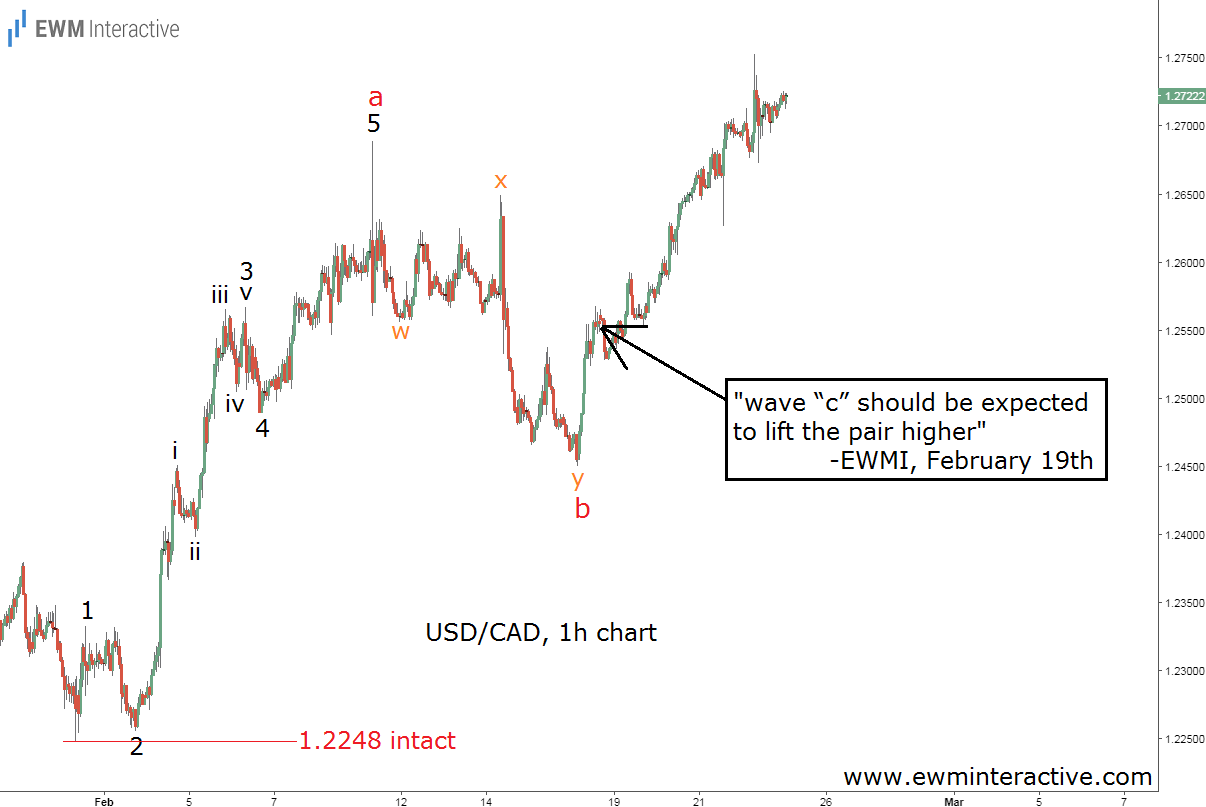
As visible, the Wave principle suggested USD/CAD should climb to a new high, because there was a five-wave impulse from 1.2248 to 1.2688, followed by a three-wave w-x-y decline to 1.2450. According to the theory, the trend resumes in the direction of the impulsive pattern. Hence, we assumed the pair should head north, towards 1.2700 for starters. Five trading days later, here is an updated chart.

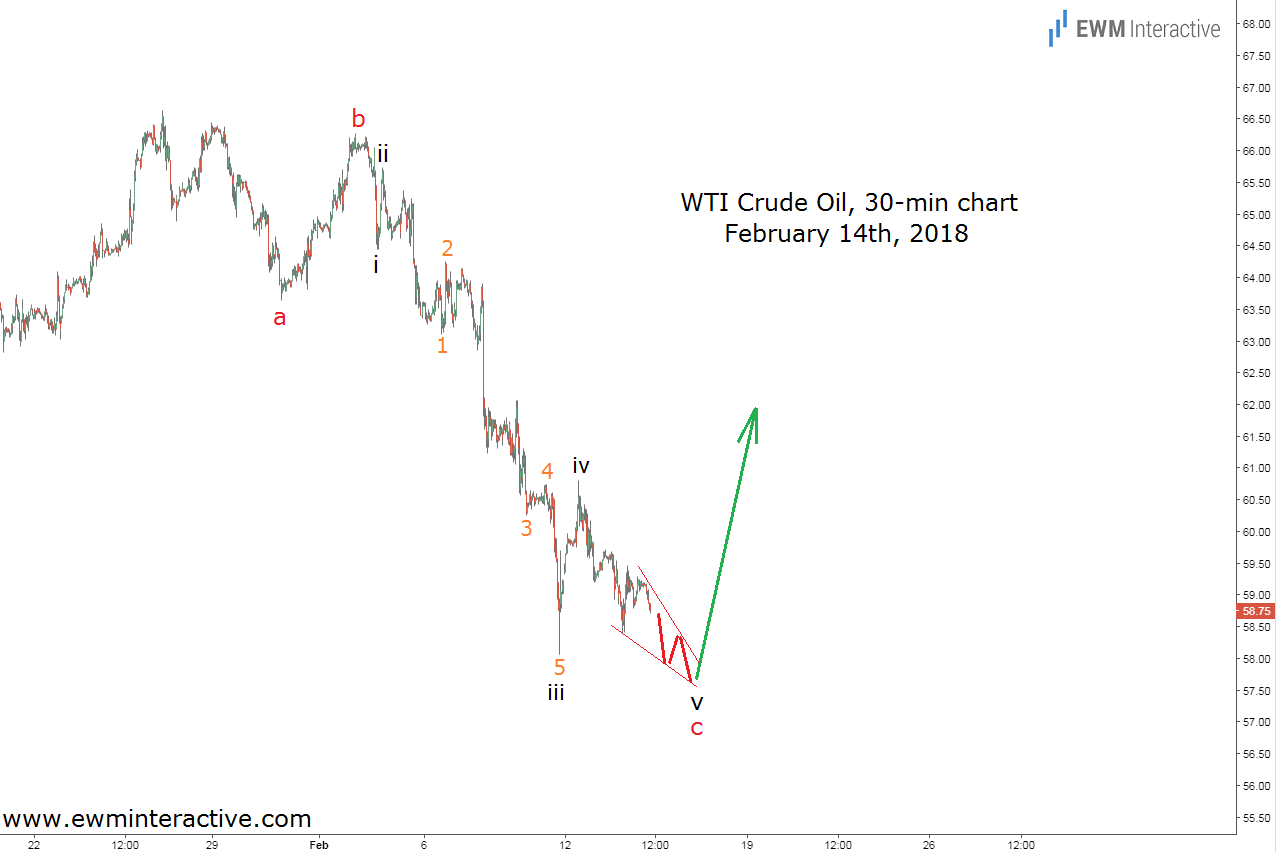
USD/CAD started climbing almost right away and the invalidation level at 1.2248 was “in a galaxy far far away.” Four days later the bulls exceeded the previous high and went for 1.2759. Unfortunately for traders, who have been relying on the negative correlation between USD/CAD and crude oil, the latter did something similar this time. The chart below was sent to subscribers as a mid-week update on Wednesday, February 14th.

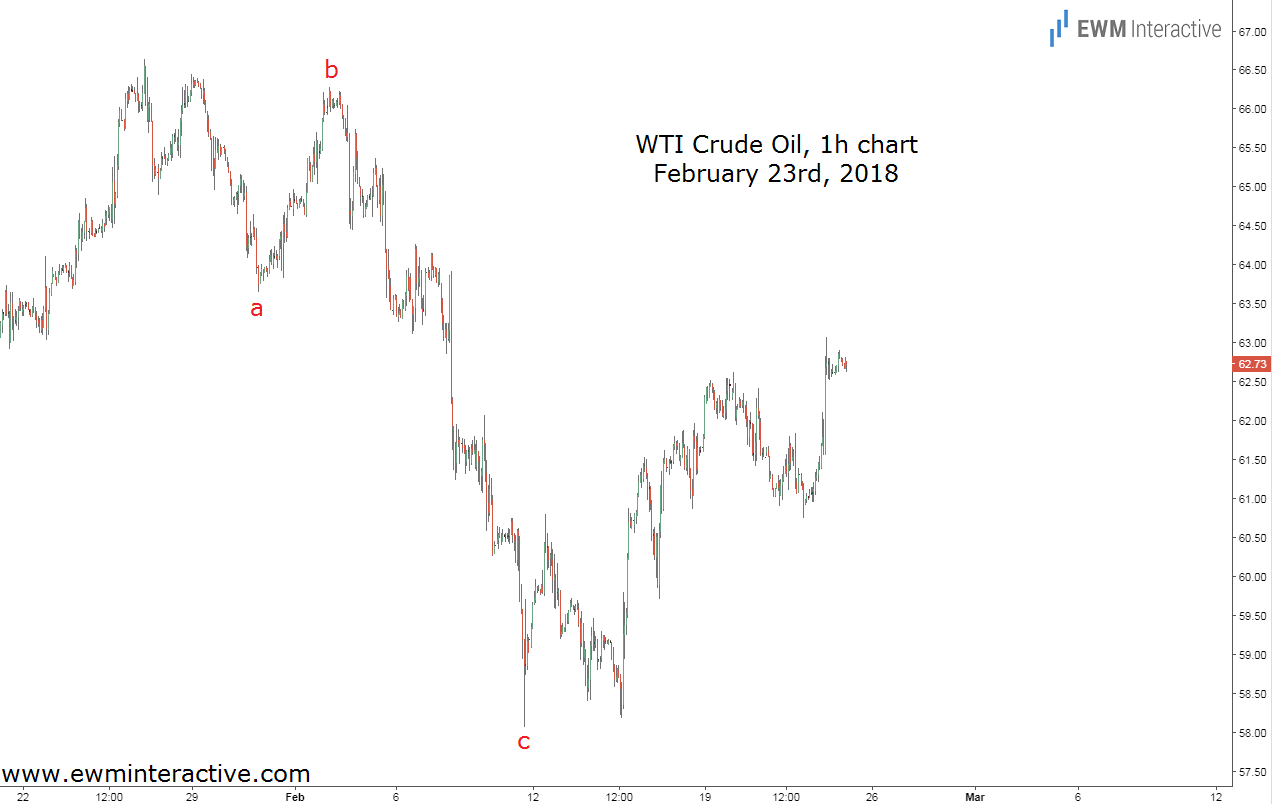
Over a week ago, crude oil was trading at $58.75, but given the bigger picture outlook as well as the corrective structure of the decline from $66.63, we thought that even if the black gold loses another dollar a barrel in wave “c”, a bullish reversal should follow. The next chart shows how the situation developed.

The price did not even make a new swing low as mixed data triggered the anticipated recovery slightly ahead of schedule. Less than two weeks later, crude oil is already looking for a decisive breach of the $63 mark.
We are not saying the negative correlation between USD/CAD and crude oil has disappeared. It has been very strong for many years and it would probably remain that way in the long-term. Nevertheless, it might even turn positive from time to time. In those rare occasions the Elliott Wave principle could make the difference.
