Turkish strengthened significantly last night as Moody’s raised the Government bond ratings to Baa3, the lowest investment grade but nonetheless a huge milestone considering that this is the first time in 2 decades that Turkey received such a rating. The Istanbul stock index jumped 1.3%, reaching the highest level since 1988 while benchmark 2Y Government bonds fell 12bps to a record low of 4.68%. However, it seems that the Lira is not able to hold onto its gains, with prices weakening during today’s trade.
Hourly Chart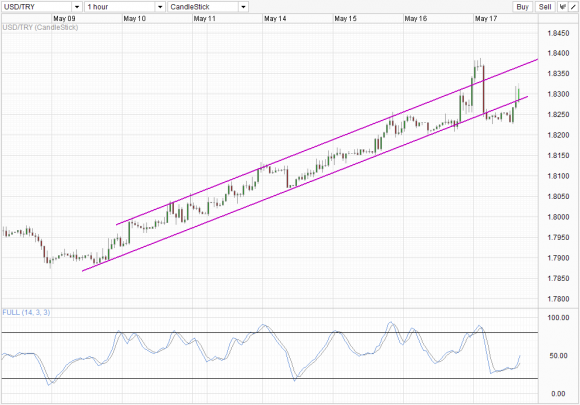 USD/TRY" title="USD/TRY" width="580" height="405">
From a technical perspective, the dip in USD/TRY was significant as it first stopped the bullish Channel breakout a few hours before. Price managed to break Channel Bottom in the next hour of trade, pushing below 1.825 but was unable to push further despite the bearish Channel breakout, suggesting that the incumbent bulls are still strong. Today’s bullish recovery back into the Channel suggest that the immediate bearish threat has been negated, and hint that bulls may be back in play again, with Channel top as potential target.
EUR/TRY Hourly Chart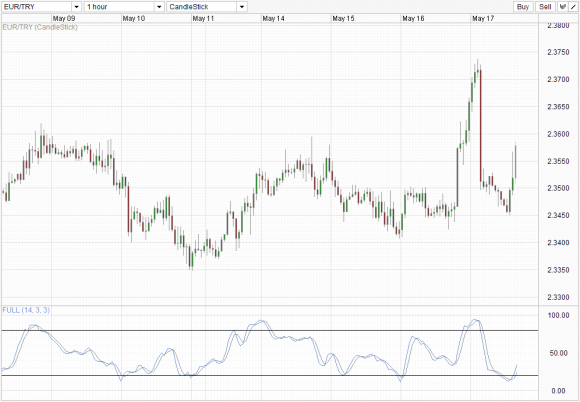 EUR/TRY_2" title="EUR/TRY_2" width="580" height="402">
As USD has been extremely strong in recent days, it is important for us to see if the rally in USD/TRY is purely due to USD strength rather than TRY weakness. Comparing with EUR/TRY, we can see that the recovery rally seen in USD/TRY is indeed due to weakness seen in TRY, which suggest that traders may have discounted the Moody’s event entirely and were generally nonplussed about it, which indicates that USD/JPY rally which is hinting to be back on track may have further roads run.
Weekly Chart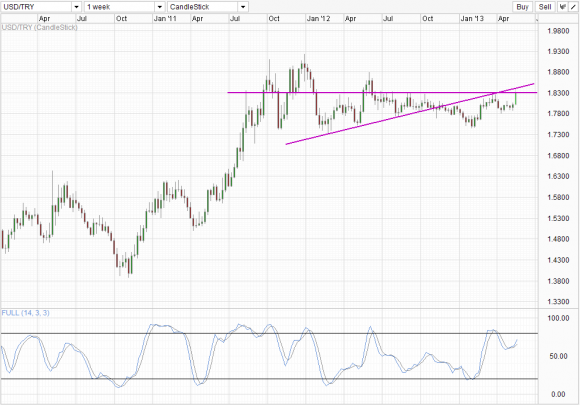 USD/TRY_3" title="USD/TRY_3" width="580" height="405">
Weekly chart on USD/TRY is generally bullish, with the rally from 2013 Low not still in play. Price is currently trading just above the 1.83 ceiling which was the previous 2013 High, with 1.88 May 2012 high as possible topside target. The rising trendline may provide some resistance, but should 1.83 confirmed to be broken, bullish pressure should allow the trendline to be broken or perhaps continue to straddle the trendline to move higher. Stochastic readings is also highly bullish with an interim trough already formed.
Fundamentally, Moody’s decision should allow TRY to appreciate in the long run. Turkish Economy Minister Zafer Caglayan said so himself. This appreciation of TRY will help reduce foreign borrowing costs, which is another long-term positive which will help in stocks and further TRY’s strength. However, USD’s current appreciation will put a spanner in the works. Given that TRY wasn’t able to maintain it’s gains earlier, any injection of further USD strength will be able to negate all the gains TRY made following the news. As such, even though fundamentals in Turkey may improve, the overall strength in USD may be able to negate TRY gains, and allow USD/TRY to climb further in 2013.
- English (UK)
- English (India)
- English (Canada)
- English (Australia)
- English (South Africa)
- English (Philippines)
- English (Nigeria)
- Deutsch
- Español (España)
- Español (México)
- Français
- Italiano
- Nederlands
- Português (Portugal)
- Polski
- Português (Brasil)
- Русский
- Türkçe
- العربية
- Ελληνικά
- Svenska
- Suomi
- עברית
- 日本語
- 한국어
- 简体中文
- 繁體中文
- Bahasa Indonesia
- Bahasa Melayu
- ไทย
- Tiếng Việt
- हिंदी
USD/TRY Pushing Higher Again Despite Moody’s Upgrade
Published 05/17/2013, 07:46 AM
Updated 07/09/2023, 06:31 AM
USD/TRY Pushing Higher Again Despite Moody’s Upgrade
3rd party Ad. Not an offer or recommendation by Investing.com. See disclosure here or
remove ads
.
Latest comments
Install Our App
Risk Disclosure: Trading in financial instruments and/or cryptocurrencies involves high risks including the risk of losing some, or all, of your investment amount, and may not be suitable for all investors. Prices of cryptocurrencies are extremely volatile and may be affected by external factors such as financial, regulatory or political events. Trading on margin increases the financial risks.
Before deciding to trade in financial instrument or cryptocurrencies you should be fully informed of the risks and costs associated with trading the financial markets, carefully consider your investment objectives, level of experience, and risk appetite, and seek professional advice where needed.
Fusion Media would like to remind you that the data contained in this website is not necessarily real-time nor accurate. The data and prices on the website are not necessarily provided by any market or exchange, but may be provided by market makers, and so prices may not be accurate and may differ from the actual price at any given market, meaning prices are indicative and not appropriate for trading purposes. Fusion Media and any provider of the data contained in this website will not accept liability for any loss or damage as a result of your trading, or your reliance on the information contained within this website.
It is prohibited to use, store, reproduce, display, modify, transmit or distribute the data contained in this website without the explicit prior written permission of Fusion Media and/or the data provider. All intellectual property rights are reserved by the providers and/or the exchange providing the data contained in this website.
Fusion Media may be compensated by the advertisers that appear on the website, based on your interaction with the advertisements or advertisers.
© 2007-2024 - Fusion Media Limited. All Rights Reserved.