USD spikes higher on optimistic tax-reform headlines
- The greenback edged higher during the Asian morning Friday, after the US Senate approved a budget blueprint for 2018, via a 51-49 vote. This is seen as a first step towards the Trump administration’s tax reform plans. Now, the next step is for the Senate to reconcile this budget with a different one that was passed by the House of Representatives earlier. The key difference between the two plans relates to the budget deficit. The Senate’s version would increase the deficit drastically, whereas the House is seeking a deficit-neutral plan.
- In our view, even though this a positive step towards reforms, meaningful tax changes still appear to be a long way off, with the tax bill likely to encounter many hurdles and delays before, and if, it is finally enacted. Moreover, given the back-and-forth negotiations that have to occur within Congress, as well as between Congress and the White House, a solid argument can be made that the final version of any tax overhaul may look very different than what the Trump administration had originally envisioned.
- As for the dollar, its outlook appears neutral for the moment. With a December Fed rate hike practically fully priced in by now, monetary policy is unlikely to be the major driver of the greenback for the next few weeks, barring some major negative surprise in economic data. Thus, we maintain the view that the greenback’s short-term direction is likely to be driven by headlines surrounding the likelihood for tax reform, as well as signals regarding the next Fed Chair. On that front, even though Trump met with Yellen yesterday, media reports suggest that his two main choices are Powell and Taylor. Given that the former is perceived as a dove and the latter as a hawk, any formal announcement on the subject could have a notable impact on market expectations regarding the future pace of monetary tightening, we think.
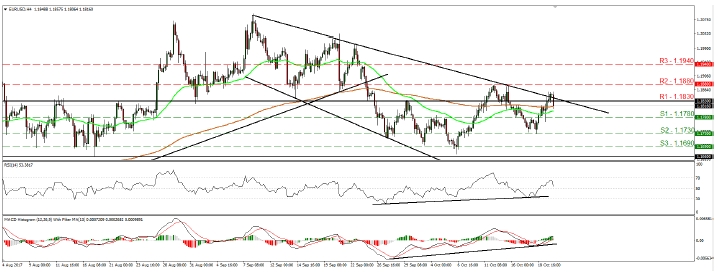
- EUR/USD edged north on Thursday, breaking above the 1.1830 (R1) key territory. However, the rate hit resistance fractionally above the downside resistance line drawn from the peak of the 8th of September, and during the Asian morning Friday it fell back below 1.1830 (R1). The rejection make us believe that the bears have taken charge, at least for now, and that they could challenge the 1.1780 (S1) line soon. A decisive dip below that level could set the stage for extensions towards our next support barrier of 1.1730 (S2). On the upside, a break above the crossroads of the 1.1830 (R1) hurdle and the aforementioned downside line is needed before we start examining the case for strong bullish extensions.
3rd party Ad. Not an offer or recommendation by Investing.com. See disclosure here or
remove ads
.
Today’s highlights:
- The main event will probably be the release of Canada’s CPI prints for September. The consensus is for the headline rate to have risen, while no forecast is available for the core. We see the case for the core rate to rise as well, considering that the nation’s Markit manufacturing PMI for the month showed prices charged rising at the strongest pace since 2014. At the time of writing, the implied probability for another BoC rate hike this year is roughly 50% according to Canada’s OIS. A strong rebound in inflation could lead market participants to push that percentage higher and thereby, support CAD. We also get the nation’s retail sales for August.
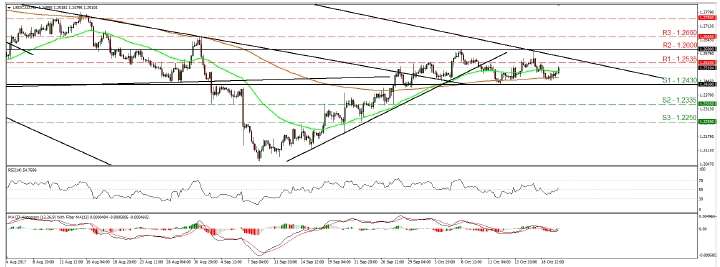
- USD/CAD traded somewhat higher during the Asian morning Friday after it hit support slightly above 1.2430 (S1) on Thursday. The pair continues to trade within the sideways range that’s been in place since the 27th of September, between 1.2430 (S1) and 1.2600 (R2). As such, we still consider the short-term outlook to be flat for now. If Canada’s CPI rates indeed rise today, then the pair may turn down again and perhaps aim for another test near the 1.2430 (S1). Nevertheless, we would like to see a clear break below that zone before we get confident on larger bearish extensions. Something like that would confirm a forthcoming lower low on the 4-hour chart and could pave the way for our next support hurdle of 1.2335 (S2). On the upside, a move above 1.2600 (R2) may signal the upside exit of the aforementioned range and could confirm a break above the longer-term downtrend line drawn from the peak of the 5th of May. Such a move could be an early sign of a medium-term trend reversal.
- In the US, existing home sales for September are due for release.
- We have only one speaker on the agenda: Cleveland Fed President Loretta Mester.
3rd party Ad. Not an offer or recommendation by Investing.com. See disclosure here or
remove ads
.
EUR/USD
Support: 1.1780 (S1), 1.1730 (S2), 1.1690 (S3)
Resistance: 1.1830 (R1), 1.1880 (R2), 1.1940 (R3)
USD/CAD
Support: 1.2430 (S1), 1.2335 (S2), 1.2250 (S3)
Resistance: 1.2535 (R1), 1.2600 (R2), 1.2660 (R3)


