
USD partially overcomes weak service PMI; weather supports natural gas
A surprisingly weak US service-sector PMI caused further mean reversion in US asset markets and weakened the dollar somewhat, but it still managed to gain against several of its G10 counterparts, indicating continued underlying strength (see technical section on EUR/USD). The December non-manufacturing ISM index fell to 53.0, a six-month low, from 53.9. The decline was largely due to a deterioration in new orders, but since that series includes many weather-sensitive sectors, such as construction and agriculture, it may be due more to the weather than to the economy. Nonetheless US bond yields fell – the 10-year Treasury was down about 4 bps – and implied interest rates on the longer-dated Fed Funds futures declined 4-5 bps, while the stock market fell for the third consecutive day, continuing the mean reversion that has characterized US asset markets in 2014. The dollar lost some support as US rates eased, yet it still managed to open this morning stronger compared with Monday morning’s levels vs CAD, AUD, JPY and NOK, albeit weaker vs EUR, GBP, SEK and NZD.
The performance of the USD/JPY is again impressive against the background of another down day for Japanese stocks, which usually implies a down day for the USD/JPY as well. Similarly, the recovery of the GBP after yesterday’s announcement that its service-sector PMI fell in December for the second consecutive month is also impressive and underlines the continued demand for that currency. A long position in the GBP/JPY might be a way of capitalizing on these two trends.
The main indicator during the European day today will be the Eurozone CPI for December. Both the headline and the preliminary core figures are expected to slow to +0.8% yoy from +0.9% yoy. The slowdown in inflation could be a concern for the ECB; their forecast for headline inflation in 2014 is 1.1%.However we do not expect a decline on this scale would be enough to cause any change in policy at this week’s meeting. Germany’s unemployment rate for December is expected to have remained unchanged at 6.9%, while France’s consumer confidence is expected to have seen no change in December from 84 in November. Later in the day, the US trade deficit is forecast to have narrowed slightly to USD 40.0bn in November from USD 40.6bn in October, although this number rarely moves markets. There are two Fed speakers scheduled during the day: Boston Fed President Eric Rosegren and San Francisco Fed President John Williams.
In addition to the economic news, investors might want to watch the US weather. The US is suffering from one of the coldest periods in the last 20 years, with temperatures in many areas approaching record lows. The market most affected by the cold weather has been US natural gas futures, which are up sharply as the coldest start to the US heating season in 13 years boosts fuel demand. Power generation accounts for 32% of US natural gas usage and about 49% of all homes use the fuel for heating, according to the US Energy Information Administration. Also, wheat prices are rising as the cold damages Great Plains winter wheat that isn’t yet covered by a layer of snow to insulate the plants. According to www.weather.com the cold is continuing throughout much of the US. Market participants looking to diversify their trades might consider looking into these markets. The question is whether there is further to go in the trade or if conditions are now fully priced in. Partially that’s up to the weather, a subject I claim no special insight into. Nonetheless we can say that the technical outlook for natural gas still seems to be bullish (see below). 
The Market
EUR/USD 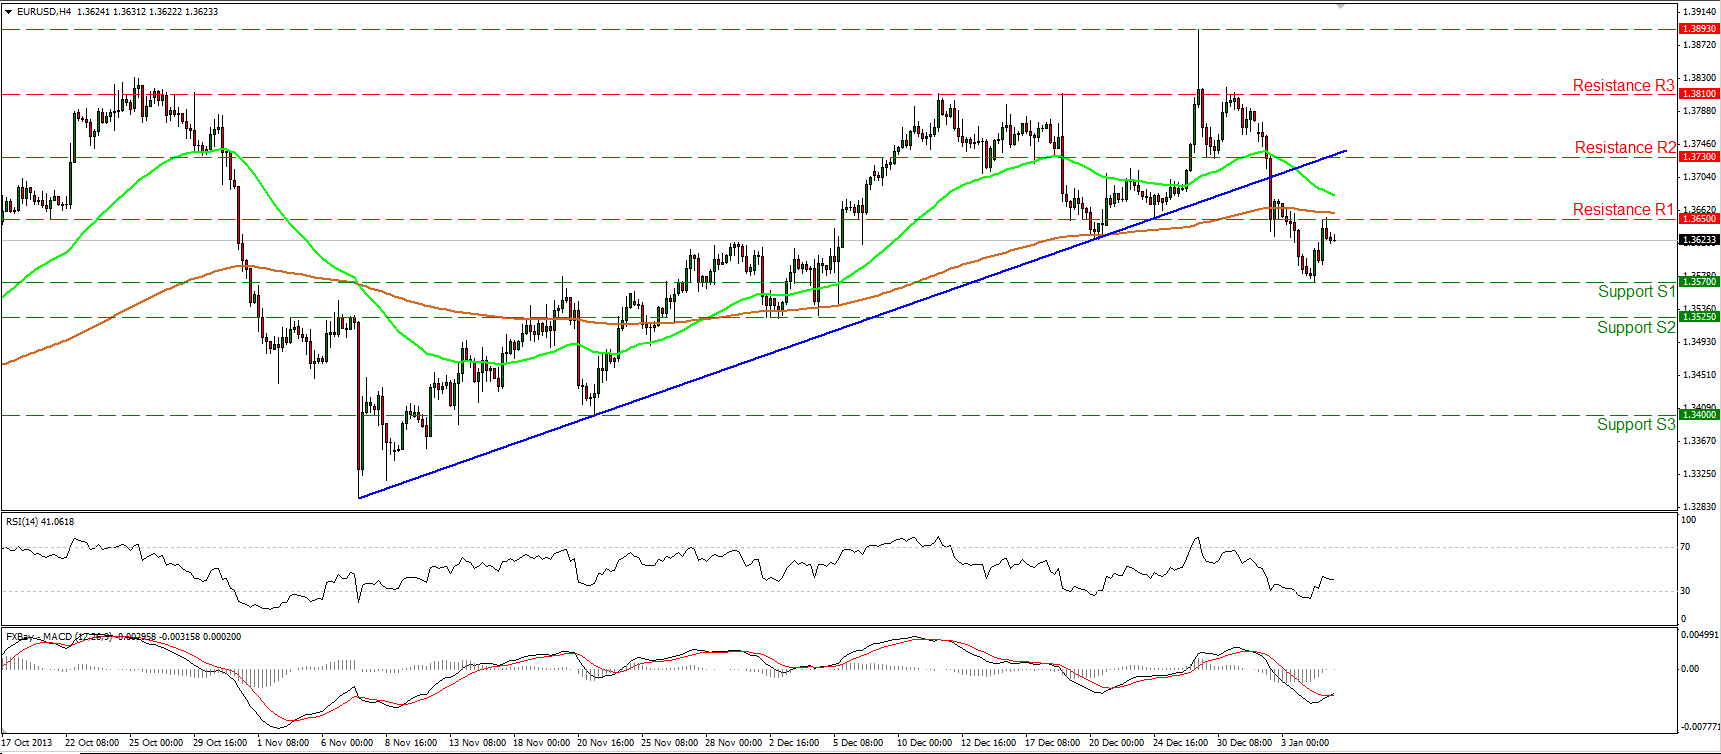 EUR/USD 4 Hour Chart" title="EUR/USD 4 Hour Chart" width="452" height="352">
The EUR/USD moved higher on Monday after forming a new low at 1.3570 (S1), but the advance was stopped at 1.3650 (R1). The 50-period moving average is getting closer to the 200-period moving average, thus a bearish cross in the near future may confirm the establishment of a new short-term downtrend. On the daily chart, we can identify negative divergence between the daily MACD and the price action, increasing the probabilities for further decline.
• Support: 1.3570 (S1), 1.3525 (S2), 1.3400 (S3).
• Resistance: 1.3650 (R1), 1.3730 (R2), 1.3810 (R3).
USD/JPY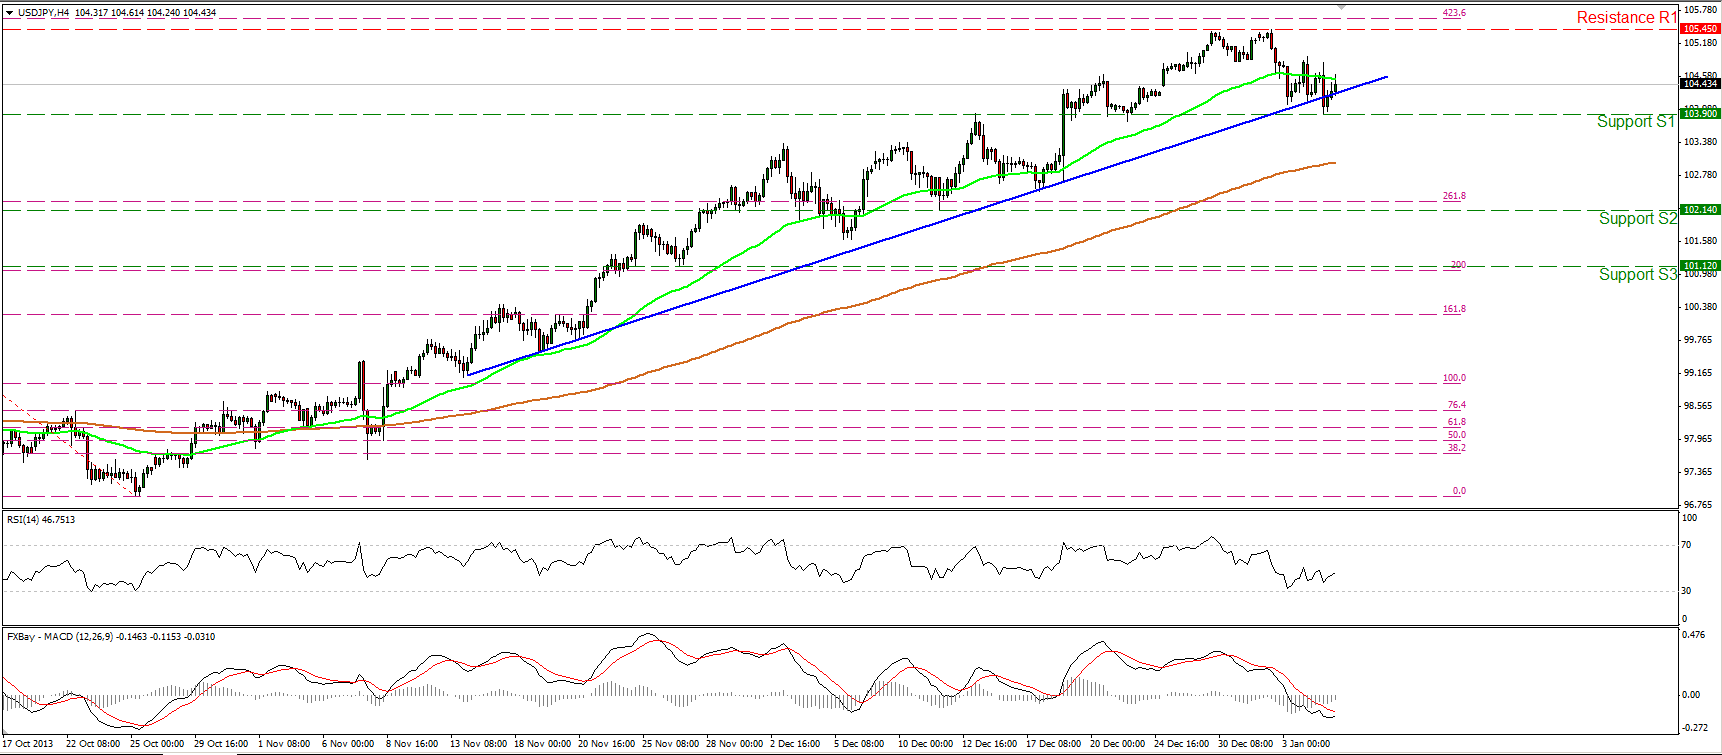 USD/JPY 4 Hour Chart" title="USD/JPY 4 Hour Chart" width="452" height="352">
The USD/JPY rebounded from the support of 103.90 (S1) and moved slightly higher. The short term uptrend remains in effect, but a break above the resistance area between the barrier of 105.45 (R1) and the 423.6% Fibonacci extension level of the 17th -25th Oct. bearish wave is needed to signal its continuation. If the longs are strong enough to overcome that strong resistance area, I would expect them to trigger extensions towards the area of 107.00 (R2).
• Support: 103.90 (S1), 102.14 (S2), 101.12 (S3).
• Resistance: 105.45 (R1), 107.00 (R2), 109.00 (R3).
EUR/GBP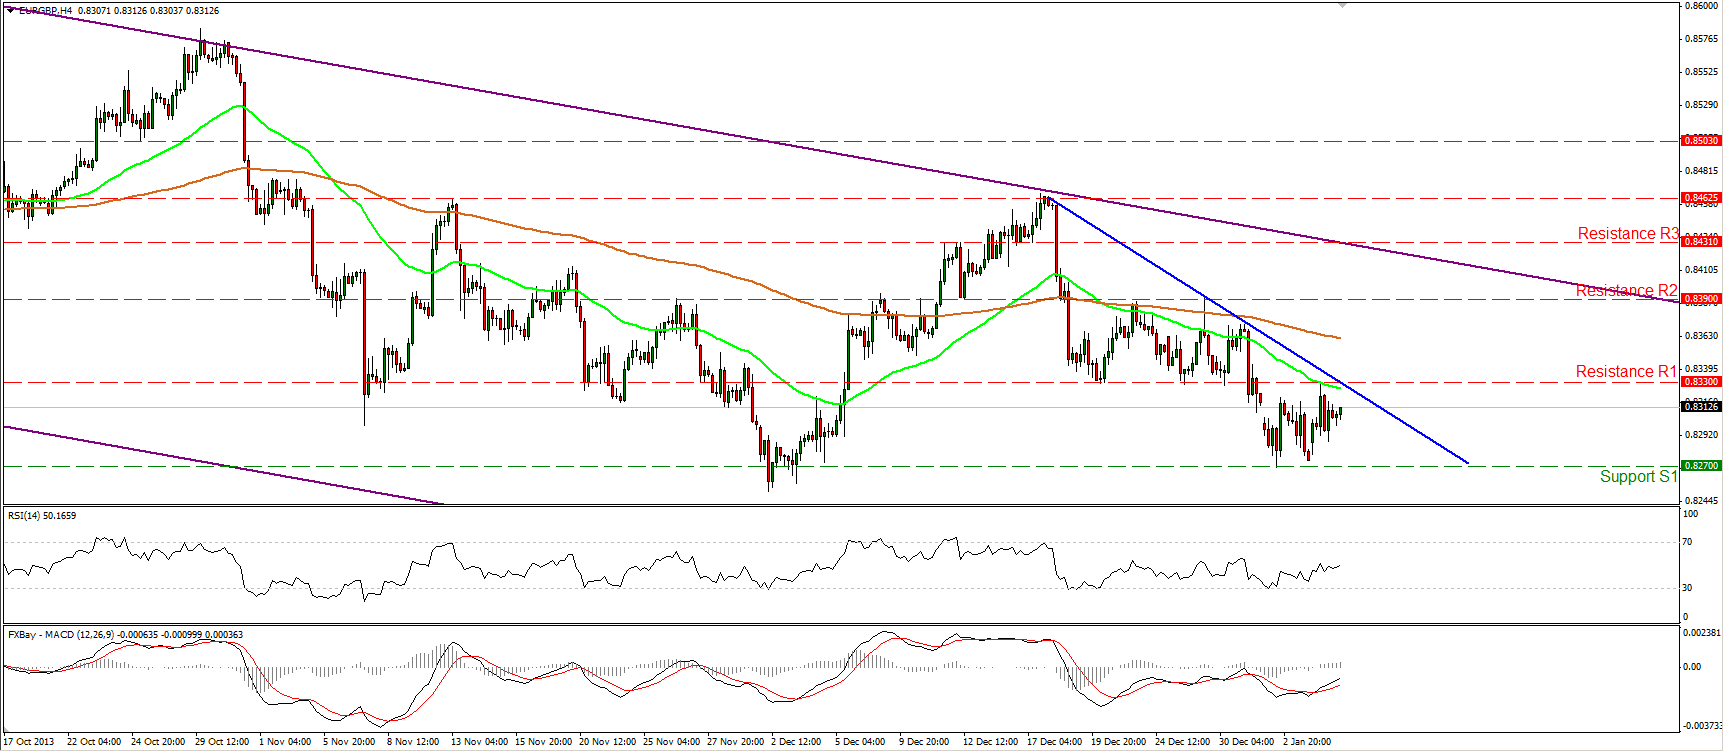 EUR/GBP 4 Hour Chart" title="EUR/GBP 4 Hour Chart" width="452" height="352">
The EUR/GBP consolidates between the support of 0.8270 (S1) and the resistance of 0.8330 (R1). The outlook remains bearish, since the pair is trading below the blue short-term downtrend line. If the bears manage to take control and drive the battle below the 0.8270 (S1) support, I would expect them to target the next support at 0.8220 (S2). On the daily chart, the rate remains within a downward sloping channel (purple lines).
• Support: 0.8270 (S1), 0.8220 (S2), 0.8080 (S3).
• Resistance: 0.8330 (R1), 0.8390 (R2), 0.8431 (R3).
Gold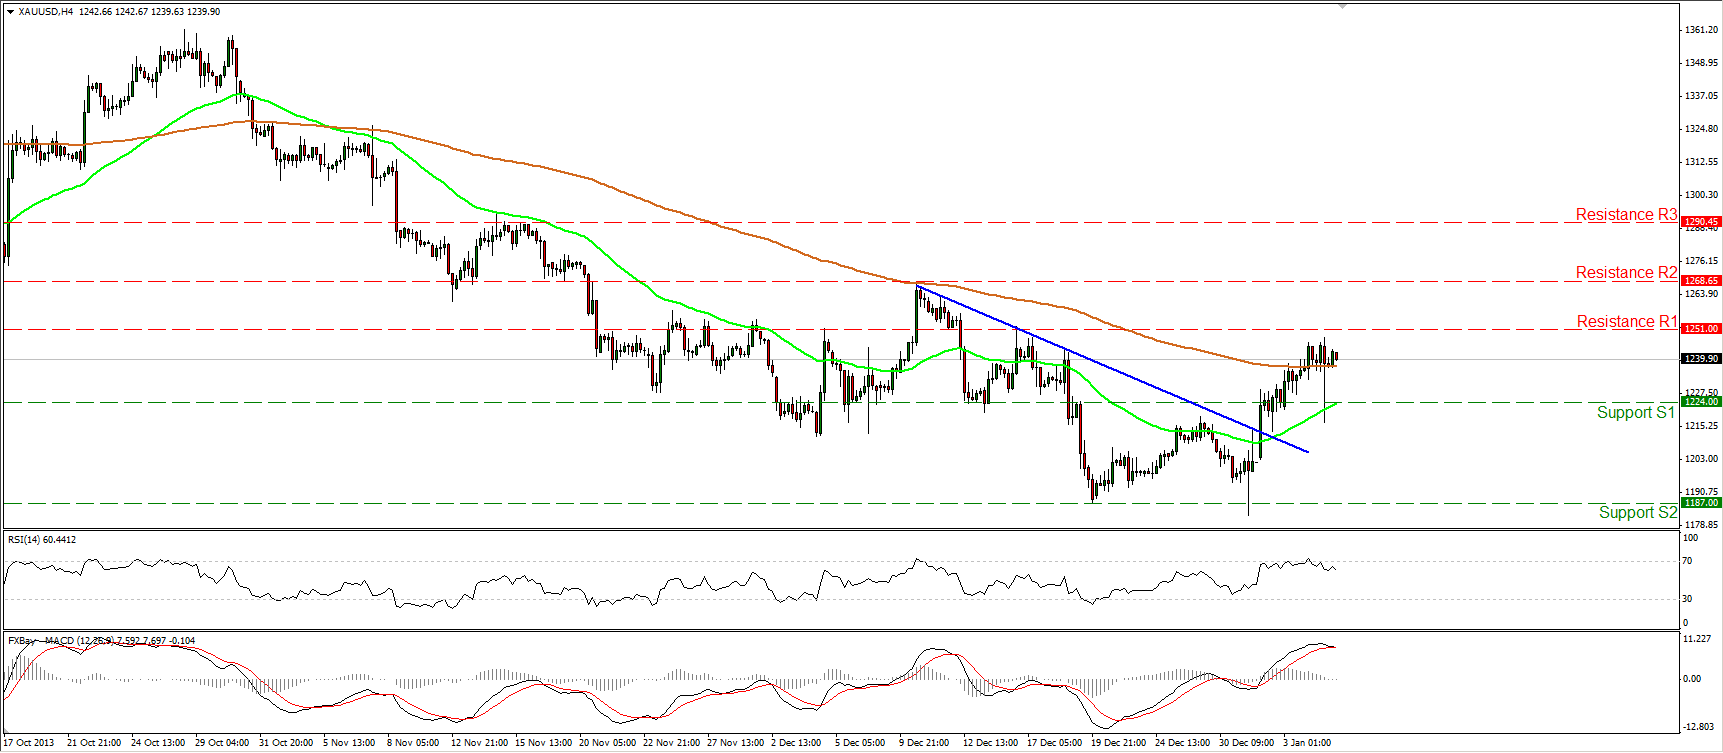 XAU/USD Hour Chart" title="XAU/USD Hour Chart" width="452" height="352">
Gold moved in a consolidative mode, remaining above the 200-period moving average and below the resistance of 1251 (R1). A break above the 1251 (R1) hurdle may trigger extensions towards the next resistance at 1268 (R2). The RSI moved slightly lower after finding resistance near its 70 level for an extended period of time, while the MACD, although in a bullish territory seems ready to cross below its trigger line, thus further consolidation or a pullback should not be ruled out. On the daily and weekly charts the longer-term downtrend remains in effect.
• Support: 1224 (S1), 1187 (S2), 1155 (S3).
• Resistance: 1251 (R1), 1268 (R2), 1290 (R3).
Natural Gas
Natural Gas is finding resistance at the red downward sloping resistance line. A violation of that line, followed by an upward break of the 4.39 (R1) hurdle, may trigger extensions towards the next resistance barrier at 4.57 (R2). The overall trend is to the upside, as indicated by the blue uptrend line and by the fact that the 50-period moving average remains above the 200-period moving average.
• Support: 4.20 (S1), 4.10 (S2), 4.00 (S3).
• Resistance: 4.39 (R1), 4.57 (R2), 4.83 (R3).
BENCHMARK CURRENCY RATES - DAILY GAINERS AND LOSERS
MARKETS SUMMARY
Disclaimer: This information is not considered as investment advice or investment recommendation but instead a marketing communication. This material has not been prepared in accordance with legal requirements designed to promote the independence of investment research, and that it is not subject to any prohibition on dealing ahead of the dissemination of investment research. IronFX may act as principal (i.e. the counterparty) when executing clients’ orders.
This material is just the personal opinion of the author(s) and client’s investment objective and risks tolerance have not been considered. IronFX is not responsible for any loss arising from any information herein contained. Past performance does not guarantee or predict any future performance. Redistribution of this material is strictly prohibited. Risk Warning: Forex and CFDs are leveraged products and involves a high level of risk. It is possible to lose all your capital. These products may not be suitable for everyone and you should ensure that you understand the risks involved. Seek independent advice if necessary. IronFx Financial Services Limited is authorised and regulated by CySEC (Licence no. 125/10). IronFX UK Limited is authorised and regulated by FCA (Registration no. 585561). IronFX (Australia) Pty Ltd is authorized and regulated by ASIC (AFSL no. 417482)
- English (UK)
- English (India)
- English (Canada)
- English (Australia)
- English (South Africa)
- English (Philippines)
- English (Nigeria)
- Deutsch
- Español (España)
- Español (México)
- Français
- Italiano
- Nederlands
- Português (Portugal)
- Polski
- Português (Brasil)
- Русский
- Türkçe
- العربية
- Ελληνικά
- Svenska
- Suomi
- עברית
- 日本語
- 한국어
- 简体中文
- 繁體中文
- Bahasa Indonesia
- Bahasa Melayu
- ไทย
- Tiếng Việt
- हिंदी
USD Partially Overcomes Weak Service PMI; Weather Supports Natural Gas
Published 01/07/2014, 06:41 AM
Updated 12/18/2019, 06:45 AM
USD Partially Overcomes Weak Service PMI; Weather Supports Natural Gas
3rd party Ad. Not an offer or recommendation by Investing.com. See disclosure here or
remove ads
.
Latest comments
Install Our App
Risk Disclosure: Trading in financial instruments and/or cryptocurrencies involves high risks including the risk of losing some, or all, of your investment amount, and may not be suitable for all investors. Prices of cryptocurrencies are extremely volatile and may be affected by external factors such as financial, regulatory or political events. Trading on margin increases the financial risks.
Before deciding to trade in financial instrument or cryptocurrencies you should be fully informed of the risks and costs associated with trading the financial markets, carefully consider your investment objectives, level of experience, and risk appetite, and seek professional advice where needed.
Fusion Media would like to remind you that the data contained in this website is not necessarily real-time nor accurate. The data and prices on the website are not necessarily provided by any market or exchange, but may be provided by market makers, and so prices may not be accurate and may differ from the actual price at any given market, meaning prices are indicative and not appropriate for trading purposes. Fusion Media and any provider of the data contained in this website will not accept liability for any loss or damage as a result of your trading, or your reliance on the information contained within this website.
It is prohibited to use, store, reproduce, display, modify, transmit or distribute the data contained in this website without the explicit prior written permission of Fusion Media and/or the data provider. All intellectual property rights are reserved by the providers and/or the exchange providing the data contained in this website.
Fusion Media may be compensated by the advertisers that appear on the website, based on your interaction with the advertisements or advertisers.
© 2007-2024 - Fusion Media Limited. All Rights Reserved.