The USD/JPY pair has been in a ranging pattern for quite some time and it looks to have reached the top of a wave. From here it is likely to head lower and we can take advantage of that, but first we must examine the technicals.
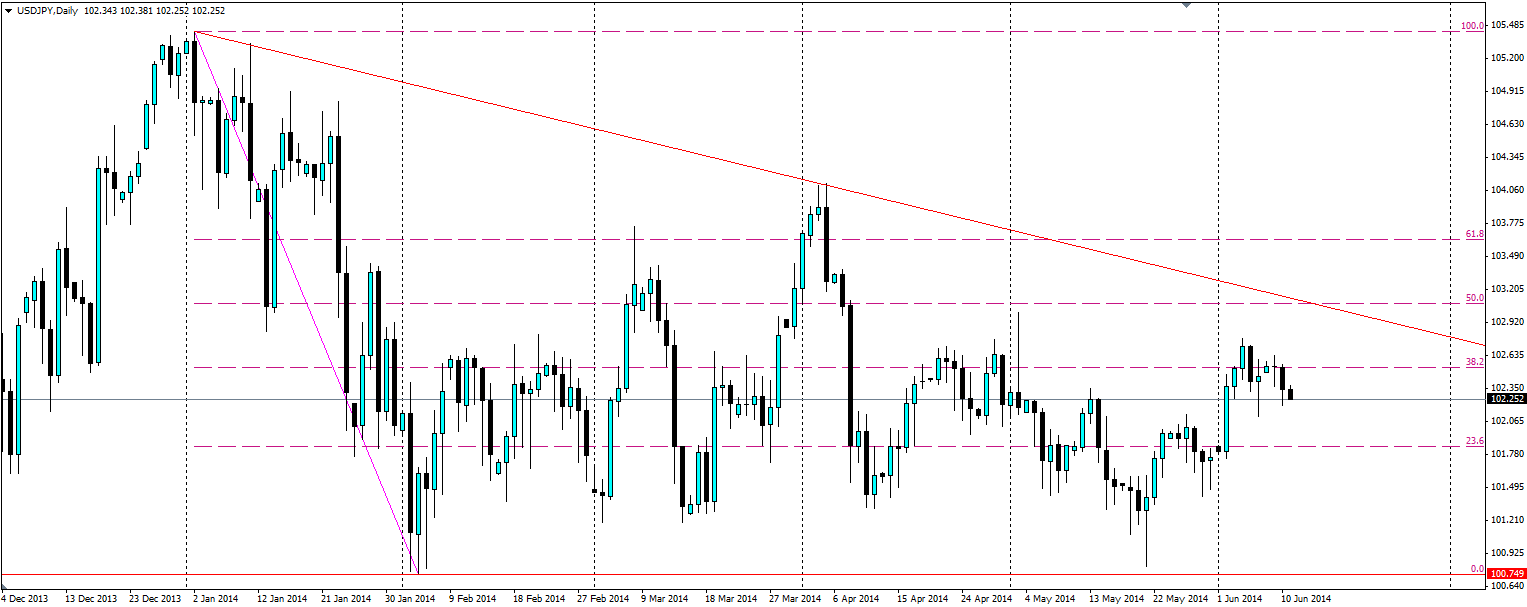
The USD/JPY pair is forming what appears to be a downward sloping triangle that peaked at the beginning of this year. Since then it has found support at the 100.75 and 101.20levels and each time bouncing higher, many times finding resistance at the 38.2% Fibonacci line around 102.52.

This current wave looks to have rejected off the 38.2% Fib line after a breakout was rejected and sent back down. The market is beginning to speculate that Japan might not add to its already monstrous stimulus plan in the near future. The expectation had been for another round of stimulus some time in the Northern Summer. The announcement this week that the Japanese economy grew by 1.6% in the first half of the year surprised many. To be fair to the statistic, it must be noted that this figure will include all the stockpiling Japanese consumers would have done before the sales tax came into effect. But what we care about is the market's expectations vs reality, and the market was surprised.
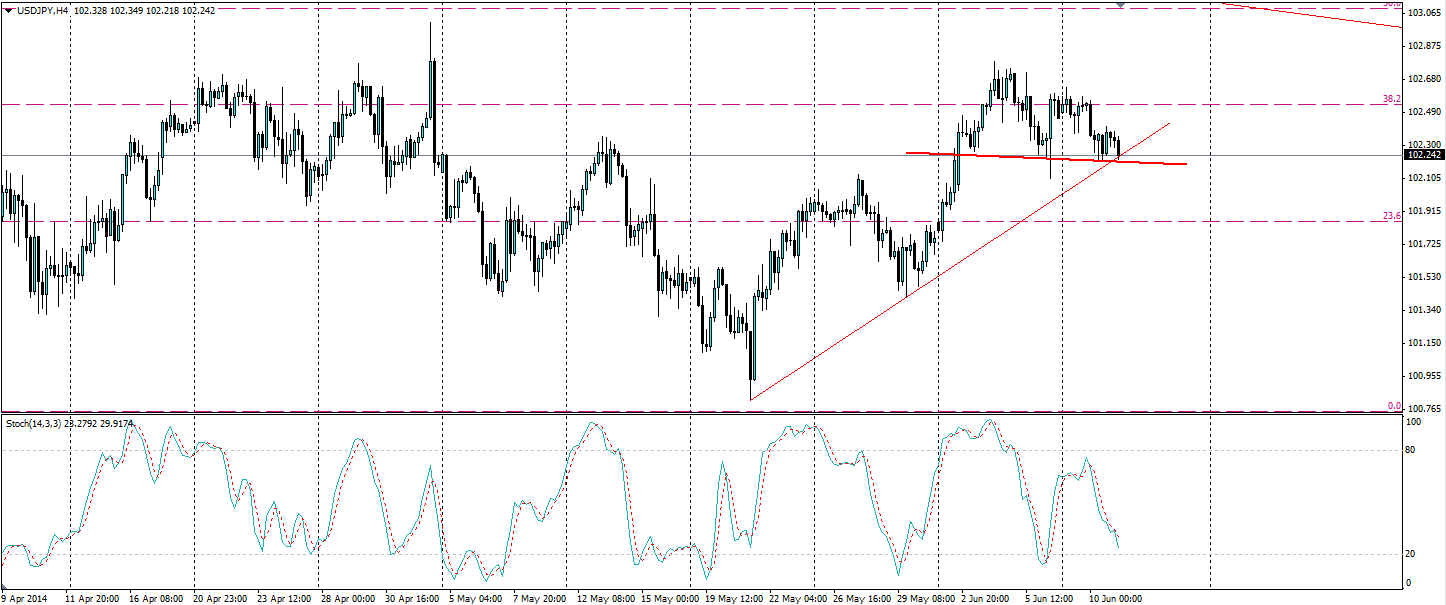
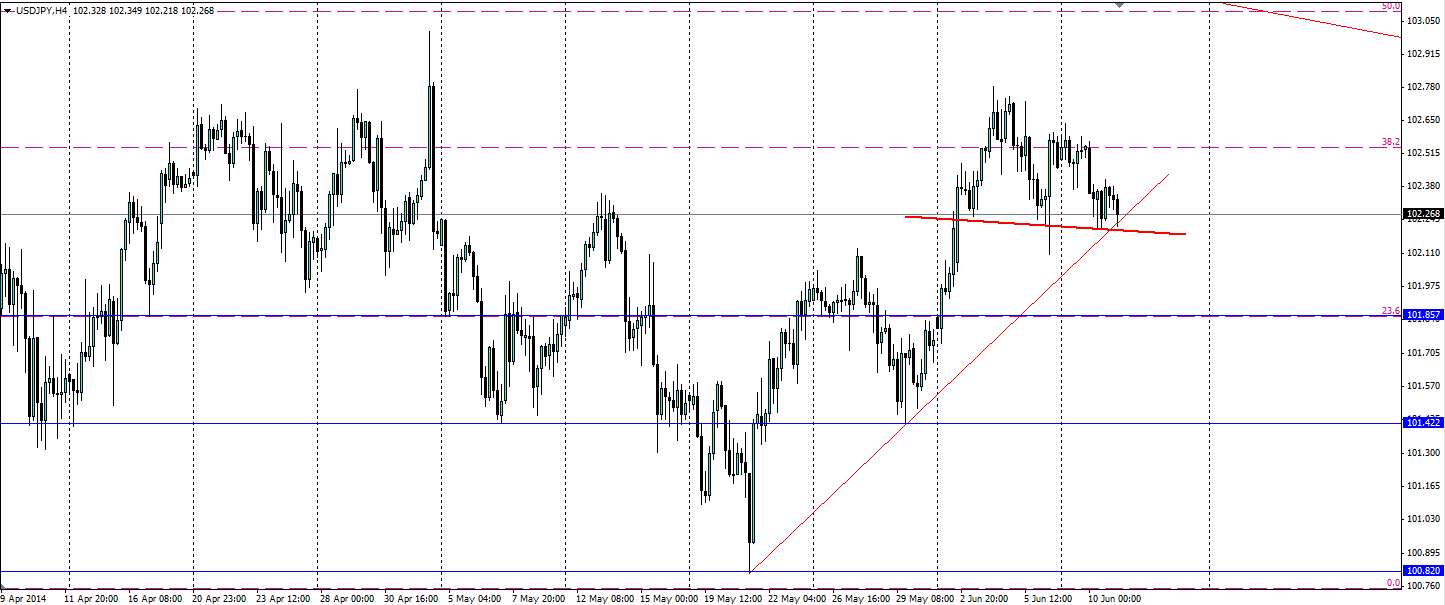
There are some technical patterns that should be taken into consideration when looking to short the USDJPY pair. The below H4 chart shows an interesting bullish trend line (the wave upwards) that has not been breached, i.e. it is still valid at this stage. The other important feature to note suggests the trend line won’t hold. This is the double top pattern above the bold red line, a clear bearish reversal pattern. Once the support at the neckline of the double top is breached, there should be a fairly quick movement downwards. The Stochastic Oscillator is certainly in favour of a bearish breakout. The current level is showing momentum is clearly with the bears at the moment and it looks to have further to fall.

Any traders looking to take advantage of a bearish breakout and a movement back down to the bottom of the downward sloping triangle could set a stop sell entry below the neckline of the double top. If this is to be breached, it will be after the bullish trend line is broken. A stop loss should be set back above the bullish trend line, just in case we have been duped by a false breakout. The obvious targets for this play are the 23.6% Fib line at 101.85 and the bottom of the previous wave at 100.82. The price may also find support at 101.42.

There is an interesting technical set up that points to a bearish breakout and a movement lower to continue the ranging patterns the USD/JPY pair has become accustomed to. Wise traders will look for a breakdown of the neck line support before entering into a trade and look for previous levels of support as exit points.
