Source: Blackwell Trader (USDJPY, D1)
The USD/JPY is starting to look quite bullish on the charts after a recent batch of heavy testing followed by positive US data for a change. But looks may be deceiving in the long run for this volatile pair which has been ranging up and down for some time.
Japanese data was a mixed bag this morning as trading and GDP data was released, with the trade balance showing a worse than expected result, (forecast -640b) coming in at -780.4b. Markets were a little anxious over the result, nevertheless they were slightly buoyed by the final GDP results q/q, which lifted to 1.6%. This is a strong result, but markets were not swayed and are looking further forward.
Why are they looking further forward? This quarter was strong as Japanese consumers rushed to spend before the tax hike. The coming quarter will likely show weaker than expected GDP results – in fact, analysts are expecting a sharp drop as has been seen in the past with tax hikes.
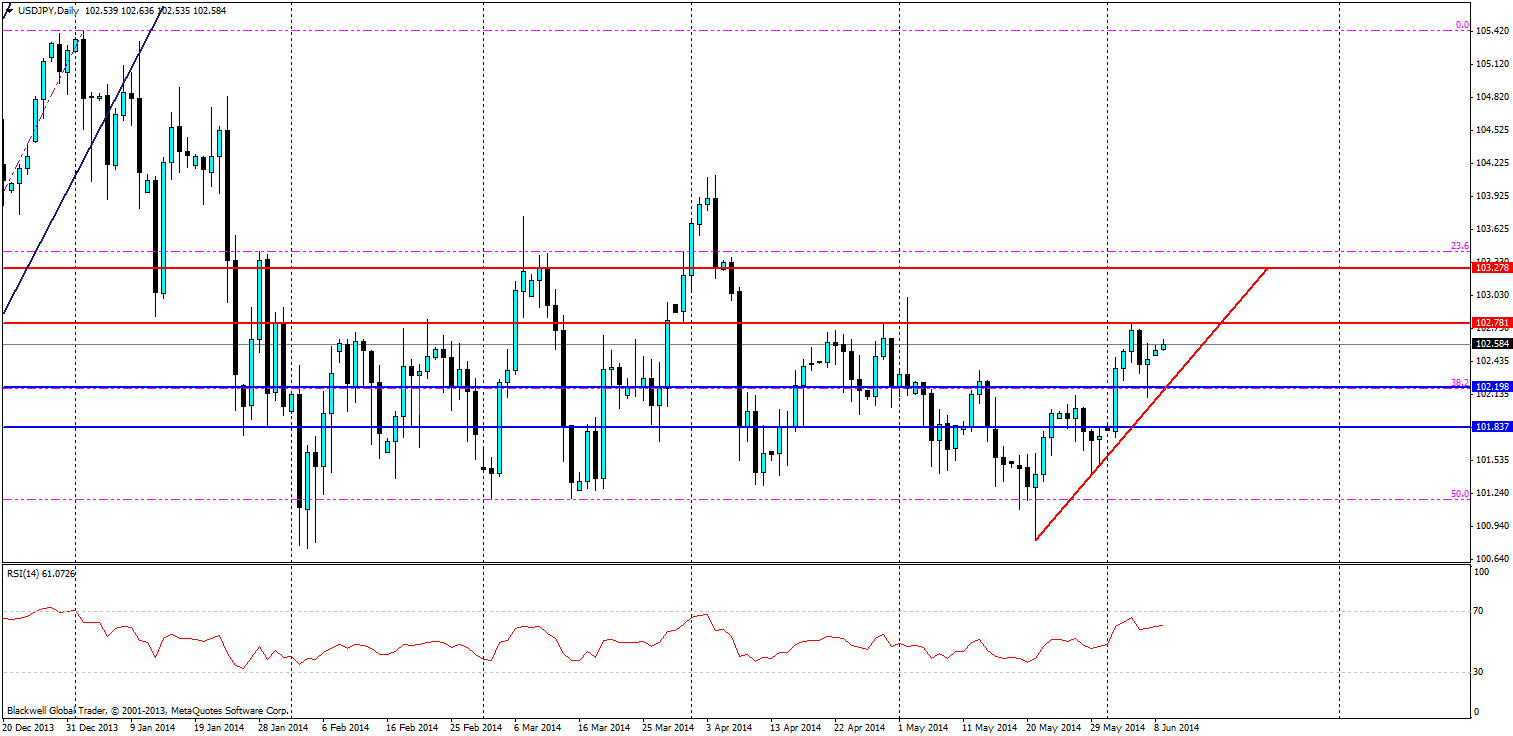
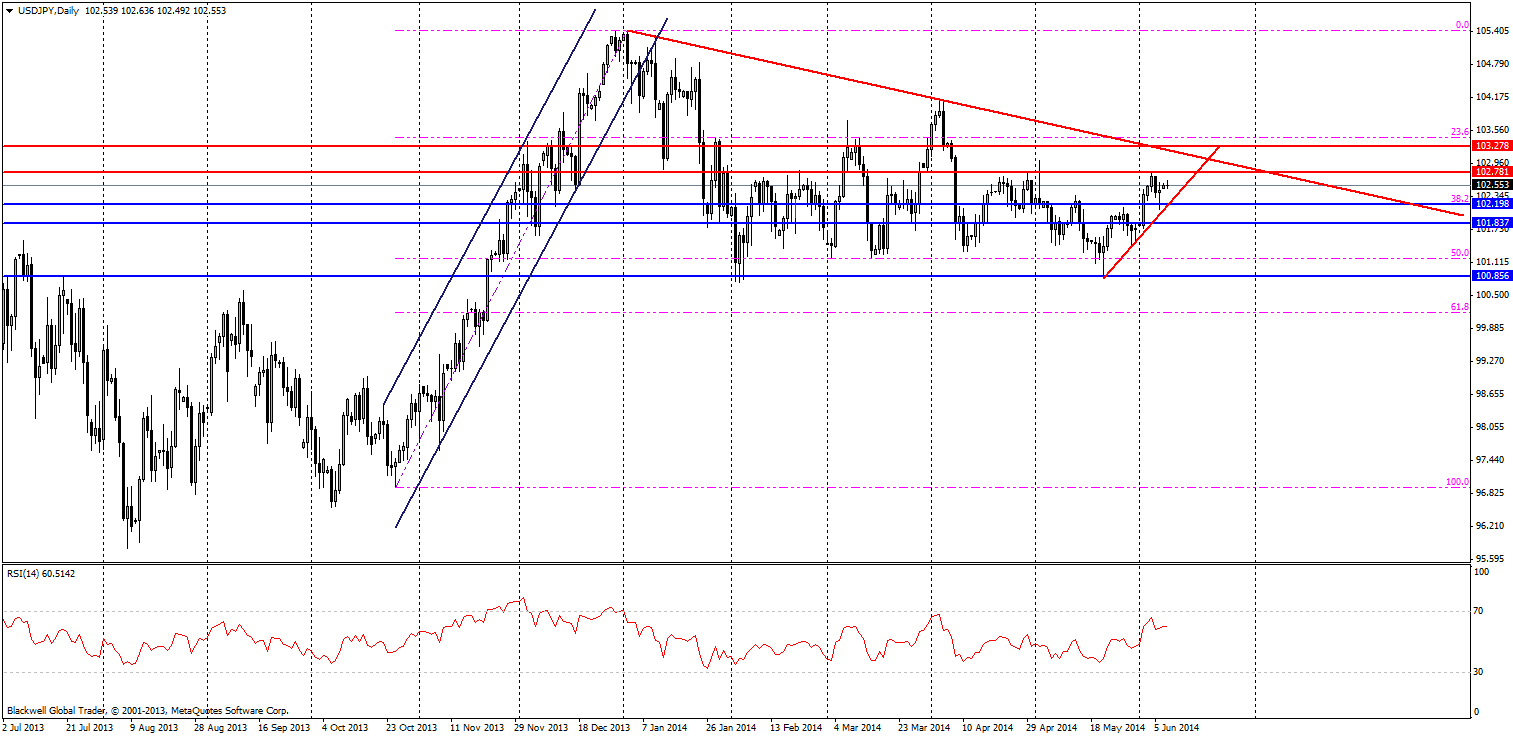
So, with the US economy booming and Japan expected to have a weak quarter, maybe a climb higher is on the cards. I think so in the short term, but there could be some resistance in the form of a bearish long term trend line which is currently in play.

Source: Blackwell Trader (USDJPY, D1)
Higher highs have been a theme on the latest wave as it climbed the chart but it’s likely that markets will push higher, or at least look to push higher. It’s just a question of time and in this case, the current chart has at least a week of upward movement before touching the trend line in question.
Resistance levels are looking fairly solid and the current bearish trend line is the main one in play. However, resistance can also be found at 102.781 and 103.278. Any movement above 103.278 would certainly signal the bulls are back in control of the market.
Support levels will be key though to see if the USD/JPY can gain momentum to go higher or if the bearish trend line will keep everything in check. Support at 102.198 (38.2 fib) is quite solid, but the trend line in the short term will likely act as dynamic support. A pull back to the trend line so far has been met by heavy buying pressure, as traders see value in the USD/JPY pair. So expect to see more, especially since traders are pricing in further falls.
Overall, the USD/JPY is bullish in the short term and I believe it has the future potential to be even more bullish. However, the bearish trend line in play is the main threat to this bullish dream for the USD/JPY. What we can probably expect though is testing of it, and traders should look to target pull backs and touches of this trend line when looking to make a play. Touching of the short term trend line should also be watched closely as traders have bought heavily as we can see from the wicks of recent candles.
