
USD/JPY (daily chart) as of March 7, 2013 has broken out above its long-term high of 94.44 set in mid-February, establishing a new 34-month high for the pair. This renewed bullishness has been in place for the past week after price made a minor pullback in late February, slightly below the 91.00 level. This also occurs within the context of a strong and steep bullish trend that has been in place for the past five months. During the course of this bullish trend there has still been very little in the way of significant pullbacks or corrections.
Although the noted late-February pullback broke below key 92.00 support, it was far from a major correction, and did not pose any real threat to the integrity of the entrenched uptrend. Currently, price is approaching its key upside target around the 95.00 resistance area. In the further event of a strong breakout above that level, the next major resistance objective to the upside resides around the 98.00 level. To the downside, key support continues to reside around 92.00.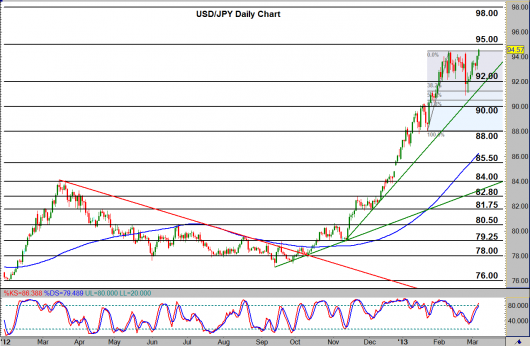 USD/JPY Daily Chart" title="USD/JPY Daily Chart" width="530" height="346">
Disclosure: FX Solutions assumes no responsibility for errors, inaccuracies or omissions in these materials. FX Solutions does not warrant the accuracy or completeness of the information, text, graphics, links or other items contained within these materials. FX Solutions shall not be liable for any special, indirect, incidental, or consequential damages, including without limitation losses, lost revenues, or lost profits that may result from these materials.
The products offered by FX Solutions are leveraged products which carry a high level of risk to your capital with the possibility of losing more than your initial investment and may not be suitable for all investors. Ensure you fully understand the risks involved and seek independent advice if necessary.
- English (UK)
- English (India)
- English (Canada)
- English (Australia)
- English (South Africa)
- English (Philippines)
- English (Nigeria)
- Deutsch
- Español (España)
- Español (México)
- Français
- Italiano
- Nederlands
- Português (Portugal)
- Polski
- Português (Brasil)
- Русский
- Türkçe
- العربية
- Ελληνικά
- Svenska
- Suomi
- עברית
- 日本語
- 한국어
- 简体中文
- 繁體中文
- Bahasa Indonesia
- Bahasa Melayu
- ไทย
- Tiếng Việt
- हिंदी
USD/JPY Hits New Long-Term High, Potential Uptrend Continuation
ByFX Solutions
AuthorJames Chen
Published 03/12/2013, 05:13 AM
Updated 01/01/2017, 02:20 AM
USD/JPY Hits New Long-Term High, Potential Uptrend Continuation
Latest comments
Loading next article…
Install Our App
Risk Disclosure: Trading in financial instruments and/or cryptocurrencies involves high risks including the risk of losing some, or all, of your investment amount, and may not be suitable for all investors. Prices of cryptocurrencies are extremely volatile and may be affected by external factors such as financial, regulatory or political events. Trading on margin increases the financial risks.
Before deciding to trade in financial instrument or cryptocurrencies you should be fully informed of the risks and costs associated with trading the financial markets, carefully consider your investment objectives, level of experience, and risk appetite, and seek professional advice where needed.
Fusion Media would like to remind you that the data contained in this website is not necessarily real-time nor accurate. The data and prices on the website are not necessarily provided by any market or exchange, but may be provided by market makers, and so prices may not be accurate and may differ from the actual price at any given market, meaning prices are indicative and not appropriate for trading purposes. Fusion Media and any provider of the data contained in this website will not accept liability for any loss or damage as a result of your trading, or your reliance on the information contained within this website.
It is prohibited to use, store, reproduce, display, modify, transmit or distribute the data contained in this website without the explicit prior written permission of Fusion Media and/or the data provider. All intellectual property rights are reserved by the providers and/or the exchange providing the data contained in this website.
Fusion Media may be compensated by the advertisers that appear on the website, based on your interaction with the advertisements or advertisers.
© 2007-2024 - Fusion Media Limited. All Rights Reserved.