The U.S. dollar opened on Monday on a weak note as the currency index was seen trading near the 90.17 handle. The declines in the USD led to a strong rally among its peers amid the U.S. holiday. The EURUSD was seen notching gains for yet another day as the common currency continued to rally through the day.
The economic calendar was sparse with not much of details to go by, leaving most of the trading to technical and broader macro-themes. The USD is expected to continue its bearish trend in the near term. However, with the ECB's meeting coming up next week, there is speculation that the ECB officials could talk down the common currency. At the same time, the hawkish meeting minutes from December raises the prospects that the ECB could maintain a balanced tone, if not coming out more hawkish.
Looking ahead, the economic data for the day will see the UK's annual inflation released. Economists forecast that the annual inflation rate rose 3.0% for the month ending in December, a slightly lower pace compared to the 3.1% increase seen the month before. Core CPI is expected to rise 2.6% on the year ending in December, down from 2.7% previously.
SNB Chairman Thomas Jordan is expected to speak during the day as well.
EUR/USD intra-day analysis

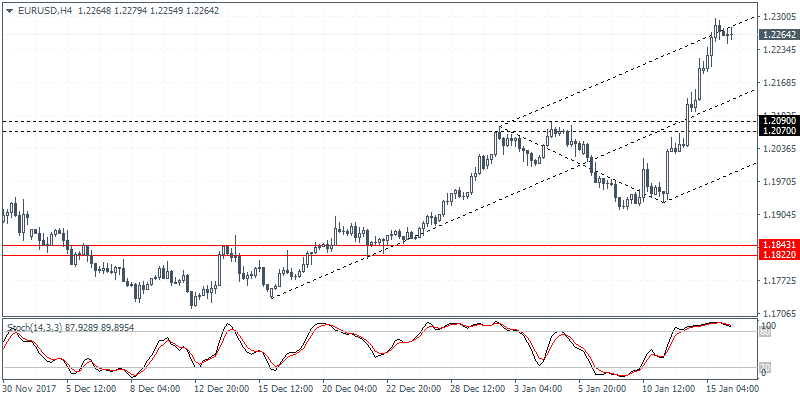
EUR/USD (1.2264):The EUR/USD posted fresh highs yesterday as price action rallied to 1.2262. The bullish momentum in the euro came amid a renewed hawkish talk from one of the ECB officials. Price action is trading close to the major resistance level of 1.2300 but we expect to see a further retest of this resistance level before we can expect a correction. Towards the downside, initial support is found at 1.2090 - 1.2070 where the declines could stall in the near term. Establishing support at this level would signal further gains that could come in the near term.
USD/JPY intra-dayanalysis

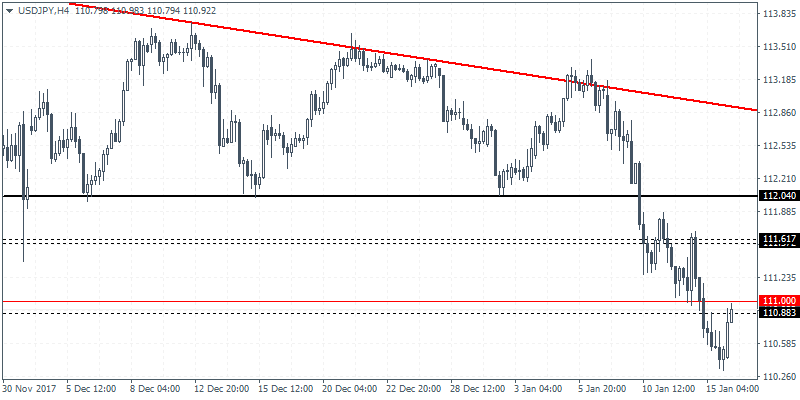
USD/JPY (110.92):The USD/JPY fell to 110.70 levels where after a brief spell of consolidation, price action is looking to post a rebound. On the intraday charts, USD/JPY is seen currently struggling near the 111.00 - 110.88 level of resistance. A reversal at this resistance level could signal that USD/JPY could potentially push lower. Breaking below the current lows at 110.70 could signal further declines to 110.00. However, this view could change if USD/JPY manages to close above the resistance level. A new sideways range could be establishing within 111.61 - 111.00 region.
NZD/USD intra-day analysis

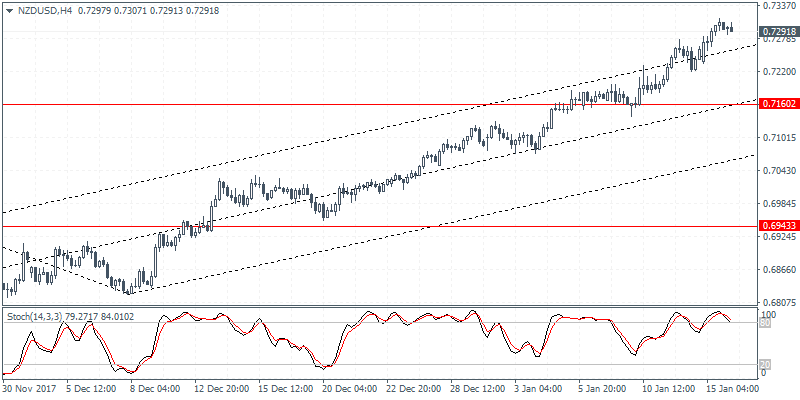
NZD/USD (0.7291):The New Zealand dollar followed a bullish engulfing pattern on the daily charts yesterday as price rallied to a 4-month high. NZD/USD closed at 0.7294. The strong breakout from the falling trend line suggests an imminent pullback in the near term. Support is seen at 0.7160 which could be tested in the medium to short term period. However, as long as NZD/USD remains firm above 0.7294, we expect to see further gains coming in store.
