Get 40% Off
🚨 Volatile Markets? Find Hidden Gems for Serious Outperformance
Find Stocks Now

USD/CAD: Triangle Top In Focus

Published 03/19/2014, 01:19 AM
Updated 07/09/2023, 06:31 AM
  • USD/CAD Technical Strategy: Flat
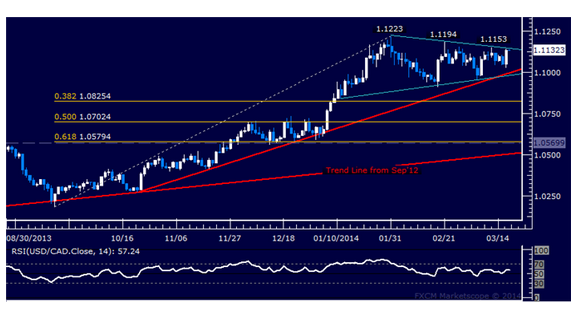
  • Support: 1.0981-95 (Triangle bottom, trend line), 1.0825 (38.2% Fib ret.)
  • Resistance: 1.1142 (Triangle top), 1.1153-1.1223 (Mar 12, Feb 21, Jan 31 highs)
  • The US dollar may be preparing to launch the next leg of its push higher against its Canadian counterpart. A period of consolidation since late January has taken the shape of a Triangle chart formation, a setup hinting at upside continuation. Clearing the Triangle top (now at 1.1142) exposes recent swing highs in the 1.1153-1.1223 area. Alternatively, a break below support at 1.0981 marked by the Triangle bottom and reinforced by a rising trend line set from late October (1.0995) exposes the 38.2% Fibonacci retracement at 1.0825.

    The Triangle setup is not actionable until confirmation is seen on a daily close above the pattern’s upper boundary. We will wait for that to materialize before looking for an attractive long trade setup.

    <span class=USD/CAD Chart" title="USD/CAD Chart" width="674" height="642">

    Original post

Latest comments

Risk Disclosure: Trading in financial instruments and/or cryptocurrencies involves high risks including the risk of losing some, or all, of your investment amount, and may not be suitable for all investors. Prices of cryptocurrencies are extremely volatile and may be affected by external factors such as financial, regulatory or political events. Trading on margin increases the financial risks.
Before deciding to trade in financial instrument or cryptocurrencies you should be fully informed of the risks and costs associated with trading the financial markets, carefully consider your investment objectives, level of experience, and risk appetite, and seek professional advice where needed.
Fusion Media would like to remind you that the data contained in this website is not necessarily real-time nor accurate. The data and prices on the website are not necessarily provided by any market or exchange, but may be provided by market makers, and so prices may not be accurate and may differ from the actual price at any given market, meaning prices are indicative and not appropriate for trading purposes. Fusion Media and any provider of the data contained in this website will not accept liability for any loss or damage as a result of your trading, or your reliance on the information contained within this website.
It is prohibited to use, store, reproduce, display, modify, transmit or distribute the data contained in this website without the explicit prior written permission of Fusion Media and/or the data provider. All intellectual property rights are reserved by the providers and/or the exchange providing the data contained in this website.
Fusion Media may be compensated by the advertisers that appear on the website, based on your interaction with the advertisements or advertisers.
© 2007-2024 - Fusion Media Limited. All Rights Reserved.