Get 40% Off
These stocks are up over 10% post earnings. Did you spot the buying opportunity? Our AI did.Read how

S&P 500 And Gold Analysis: March 7, 2018

Published 03/07/2018, 05:34 AM
Updated 03/21/2024, 07:45 AM

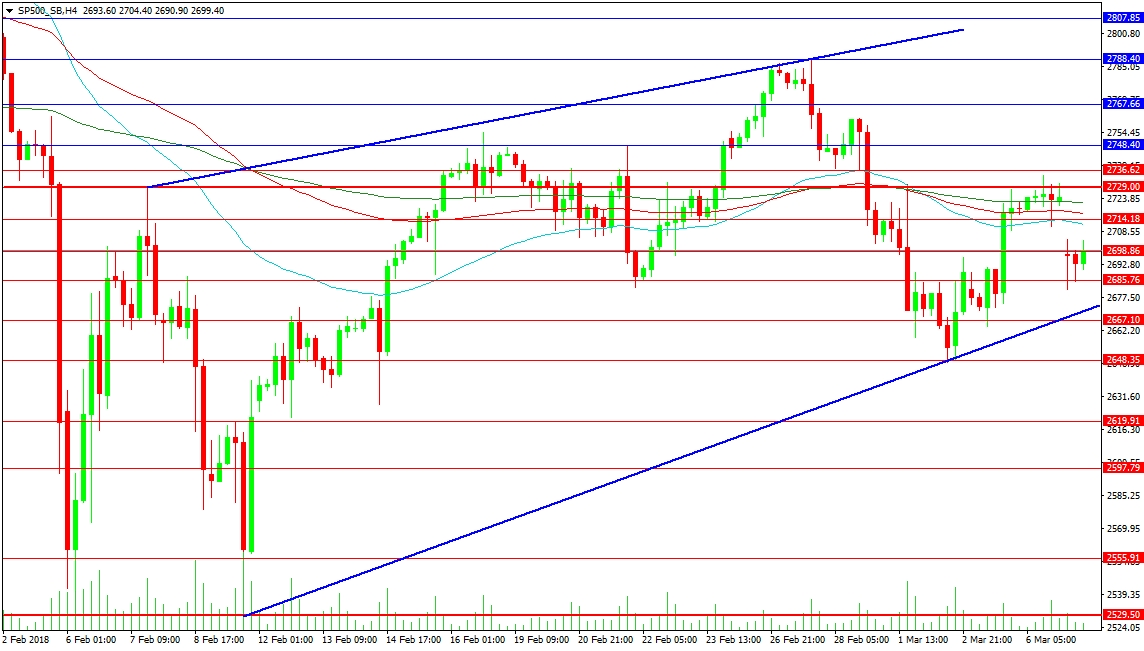
The US index has taken a fall lower with worries over trade tariffs. Today, it is opening with a gap down after the US Chief Economic Advisor to President Trump resigned last night. This raises the risk of a trade war taking place. The price has found support around the 2680.00 area and has a rising trend line adding support at 2671.50. A fall below this trend line suggests that the 2650.00 area could be targeted, with recent lows at 2647.30. A move under this area creates a lower low and can start taking out bullish stops down to 2600.00. Bearish traders are targeting the lows of 2018, around 2529.00 initially, with 2500.00 below.

Resistance can be found at 2700.00, with 2714.18 above, supported by the 4-hour moving averages in a tight band between 2711.00 and 2721.75. The next resistance comes at 2729.00 and 2736.62. Breaks higher above this area would create a higher high, which would be confirmed with a move through 2788.40, with trend line resistance at 2810.00.

US500 4-Hour Chart

Gold

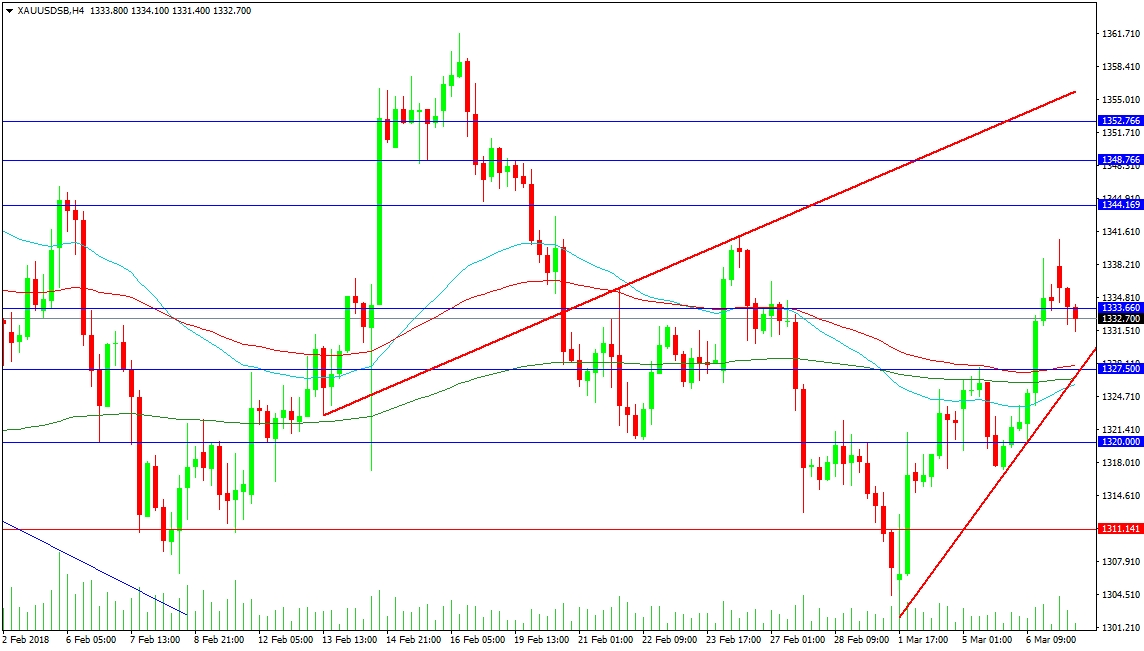
With risk-off sentiment in the markets and a flight to safety taking place, the precious metal has seen a modest recovery from the 1300.00 support area. This has resulted in a bullish move to test resistance at 1340.00, with price pulling back to support at 1331.50. Further support is firming up in the 1327.50 area as the moving averages in the 4-Hour timeframe turn higher and the supporting trend line of the bullish move rises up. Further support is seen at 1320.00 and the 1311.14 level. As mentioned, 1300.00 is a strong area extending down as far as 1290.00.

3rd party Ad. Not an offer or recommendation by Investing.com. See disclosure here or remove ads .

Resistance comes at the 1333.60 area, which price is currently struggling with. A break above this week’s highs targets the 1344.17 level, followed by the 1350.00 area and red trend line resistance at 1355.70. Above here, resistance is found at 1361.5 and 1365.00.

Gold 4-Hour Chart

Latest comments

Risk Disclosure: Trading in financial instruments and/or cryptocurrencies involves high risks including the risk of losing some, or all, of your investment amount, and may not be suitable for all investors. Prices of cryptocurrencies are extremely volatile and may be affected by external factors such as financial, regulatory or political events. Trading on margin increases the financial risks.
Before deciding to trade in financial instrument or cryptocurrencies you should be fully informed of the risks and costs associated with trading the financial markets, carefully consider your investment objectives, level of experience, and risk appetite, and seek professional advice where needed.
Fusion Media would like to remind you that the data contained in this website is not necessarily real-time nor accurate. The data and prices on the website are not necessarily provided by any market or exchange, but may be provided by market makers, and so prices may not be accurate and may differ from the actual price at any given market, meaning prices are indicative and not appropriate for trading purposes. Fusion Media and any provider of the data contained in this website will not accept liability for any loss or damage as a result of your trading, or your reliance on the information contained within this website.
It is prohibited to use, store, reproduce, display, modify, transmit or distribute the data contained in this website without the explicit prior written permission of Fusion Media and/or the data provider. All intellectual property rights are reserved by the providers and/or the exchange providing the data contained in this website.
Fusion Media may be compensated by the advertisers that appear on the website, based on your interaction with the advertisements or advertisers.
© 2007-2024 - Fusion Media Limited. All Rights Reserved.