Upcoming US Events for Today:- Chain Store Sales for February will be released throughout the day.
- Weekly Jobless Claims will be released at 8:30am. The market expects Initial Claims to show 338K versus 348K previous.
- Productivity for the Fourth Quarter will be released at 8:30am. The market expects a quarter-over-quarter increase of 2.4% versus an increase of 3.2% previous.
- Factory Order for January will be released at 10:00am. The market expects a month-over-month decline of 0.5% versus an decline of 1.5% previous.
Upcoming International Events for Today:
- German Manufacturers Orders for January will be released at 6:00am EST. The market expects a year-over-year increase of 7.5% versus an increase of 6.0% previous.
- Bank of England Rate Announcement will be released at 7:00am EST. The market expects no change at 0.5%.
- ECB Rate Announcement will be released at 7:45am EST. The market expects no change at 0.25%.
- Canadian Ivey PMI for February will be released at 10:00am EST. The market expects 52.9 versus 56.8 previous.
The Markets
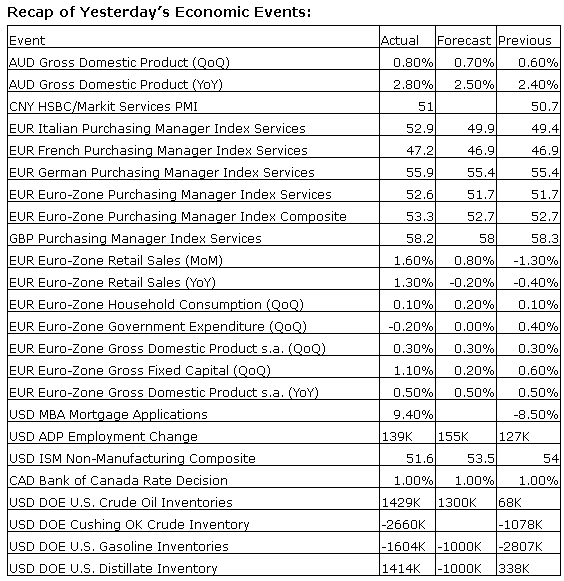
Stocks ended around the flatline on Wednesday, consolidating at the all-time highs amidst a weaker than expected read on employment and the services sector in the US. ADP reported that payrolls increased by 139,000 last month, falling short of estimates calling for an increase of 155,000. Yet again, the perception amongst investors is that weather is a factor behind the weak result. The BLS Employment report is scheduled to be released on Friday and expectations are likely to be lowered, giving this key economic indicator another pass for the month. However, this may be the last month investors will be willing to be kind enough to let weak economic datapoints get a passing grade due to the winter weather conditions; it is rare for weather to be used as a reason for weak economic conditions three months in a row. Only time will tell what March will bring.
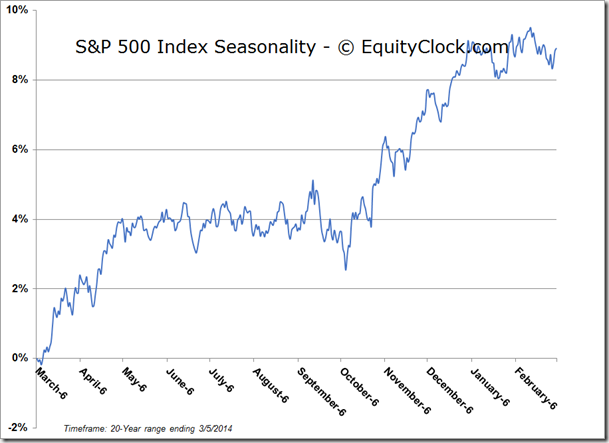
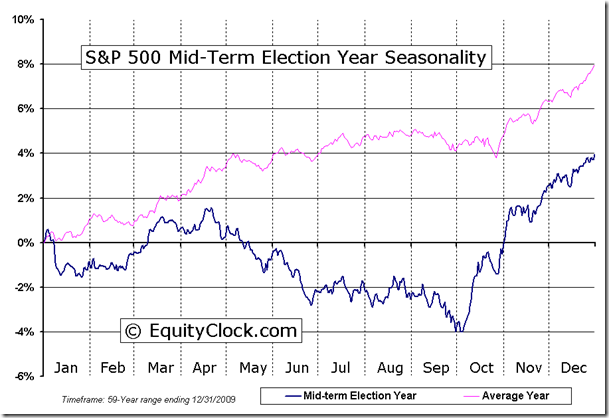
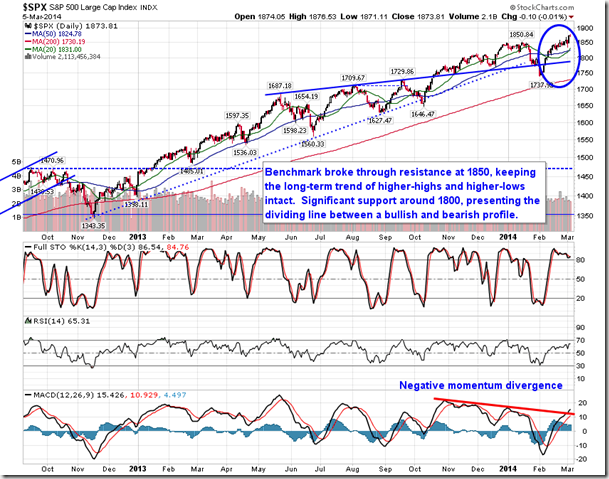
Overall, despite the impact of the inclement winter weather in the US Northeast, the path of the S&P 500 index so far this year has been consistent with what occurs, on average, during mid-term election years. During the second year of a presidential term, an unseasonably weak January is followed by a rebound through the month of February, which leads into a strong March followed by an April peak. It can be argued that January and February meet that description, and March is off to a similar start with the strong returns generated on Tuesday. If the pattern holds true, the present up-leg in equity markets could reach a major peak in the next 5 to 8 weeks, potentially preceding one of the most pronounced corrections that the market has realized in well over a year. Mid-term election years are typically weaker than the average seasonal trend through the first 9 months of the year due to the uncertainty leading into the elections that take place in November. Don’t be surprised if a similar outcome is realized this mid-term election year.
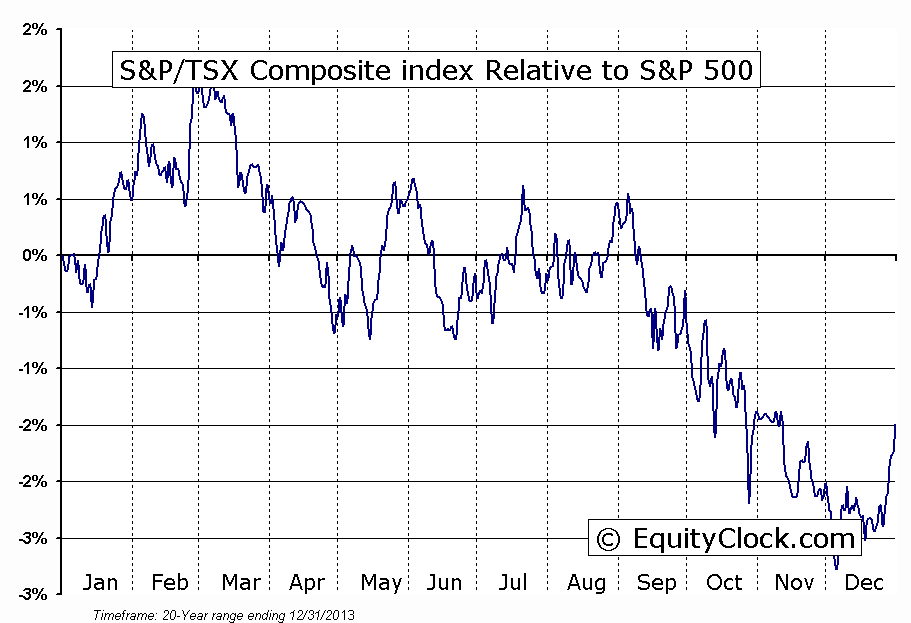
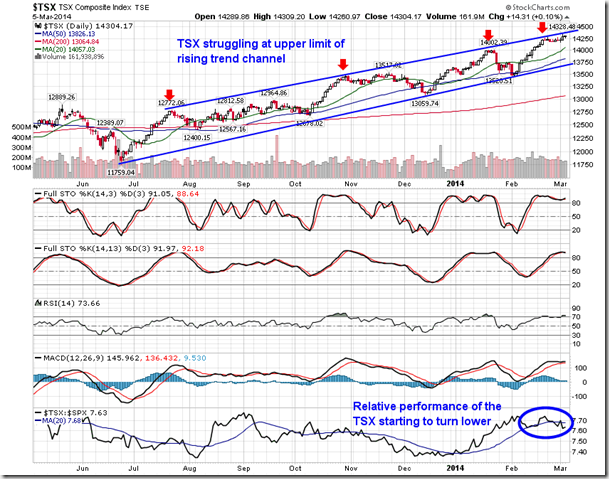
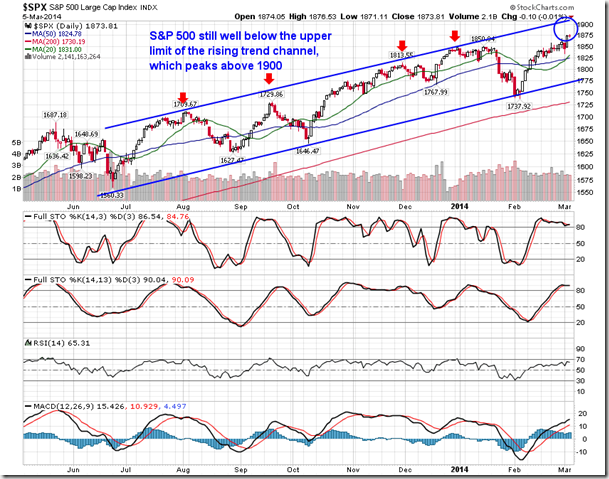
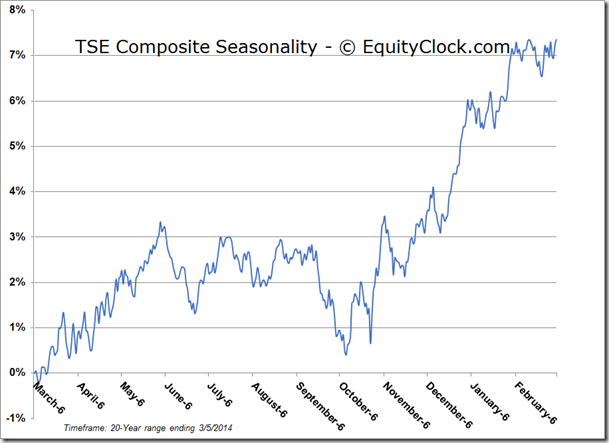
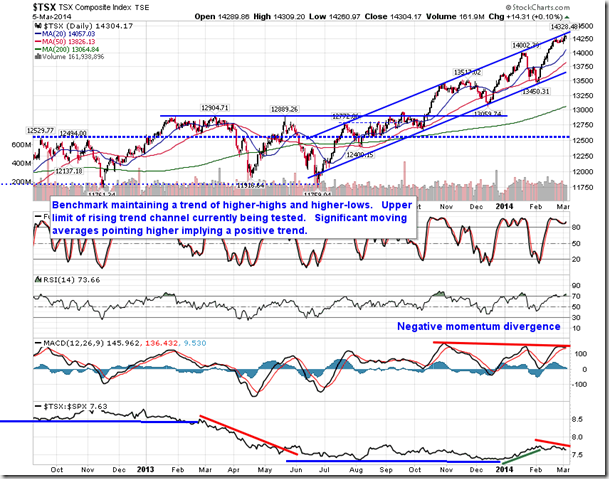
The outperformance of Canadian stocks may be coming to an end. The TSE Composite Index has been a stellar performer so far this year, gaining 5% year-to-date during what has otherwise been a flat year for many worldwide equity benchmarks. However, positive seasonal tendencies that lead to strength in the Canadian market versus the rest of the world are coming to an end. The TSX seasonally outperforms the S&P 500 from the end of December through to the beginning of March as a result of strength in the Materials, Energy, and Financials sectors. The Canadian equity benchmark then seasonally underperforms the S&P 500 from March through to the beginning of May. Strength in the Consumer Discretionary and Industrial sectors, two areas of the market that the S&P 500 has greater exposure to, are factors behind the outperformance in the American benchmark. This seasonal switch is becoming evident once again. The TSX had recently started to underperform the S&P 500 as the Canadian benchmark struggles around the upper limit of a rising trend channel; the S&P 500, however, remains well below the equivalent level of resistance. Assuming the trend channels for each benchmark remain intact, the better opportunity for investors over the next 5 to 8 weeks may be in the S&P 500 (US stocks) as opposed to the TSX Composite (Canadian stocks).
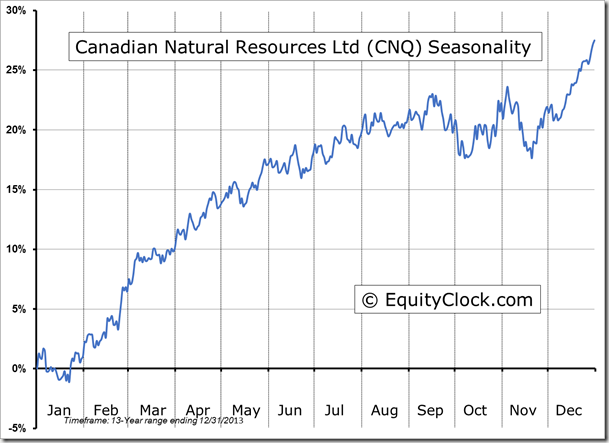
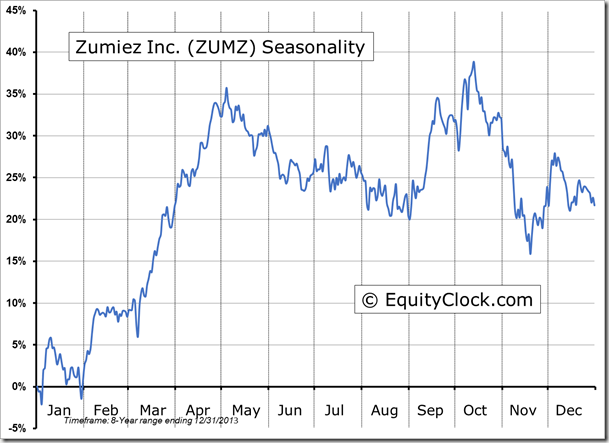
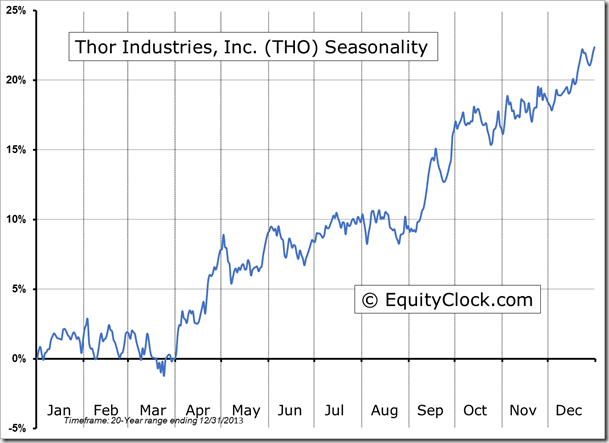
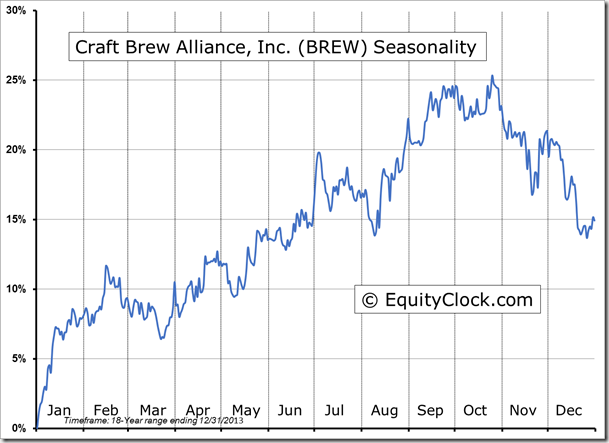
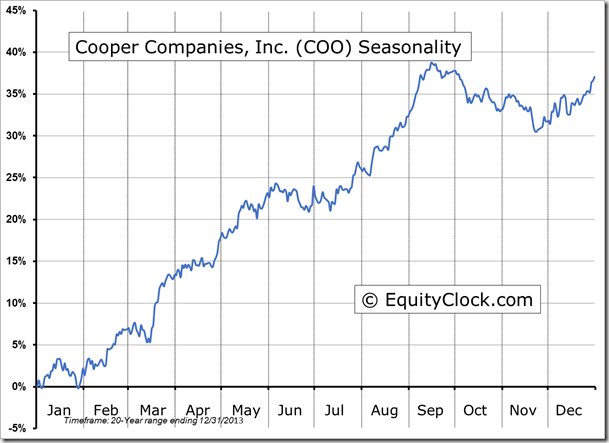
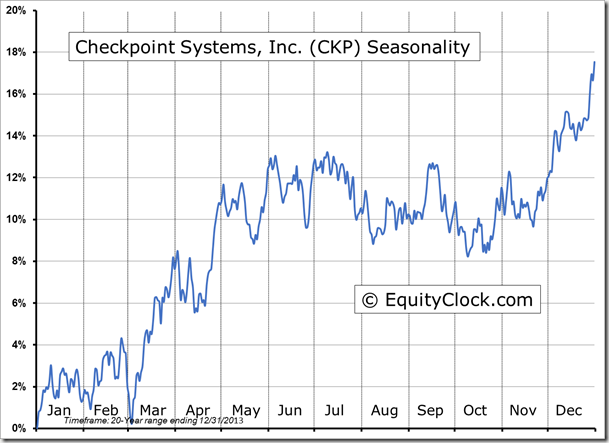
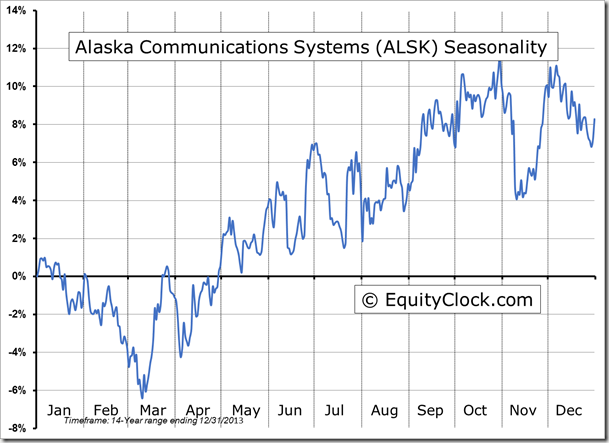
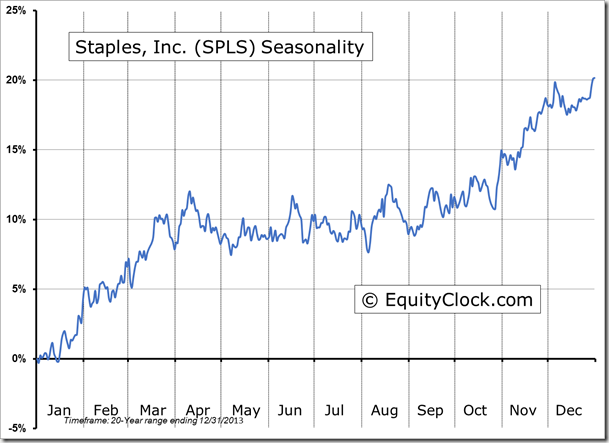
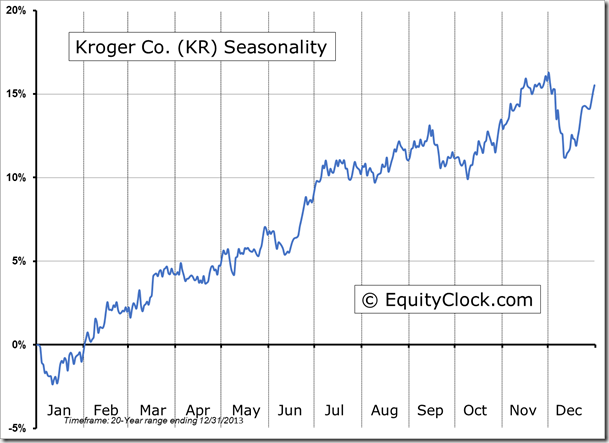
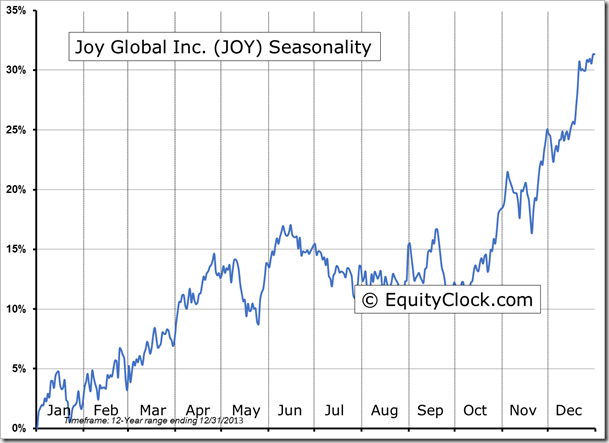
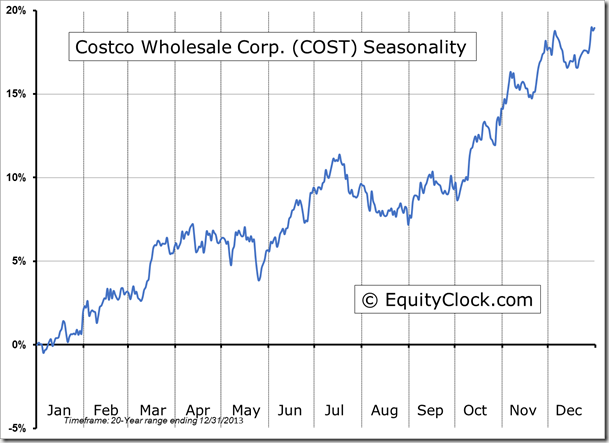
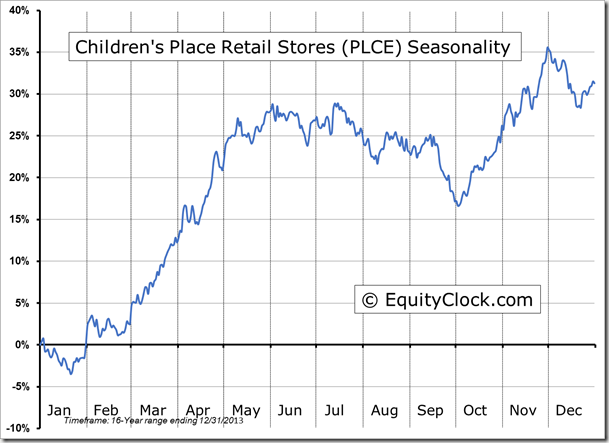
Seasonal charts of companies reporting earnings today:
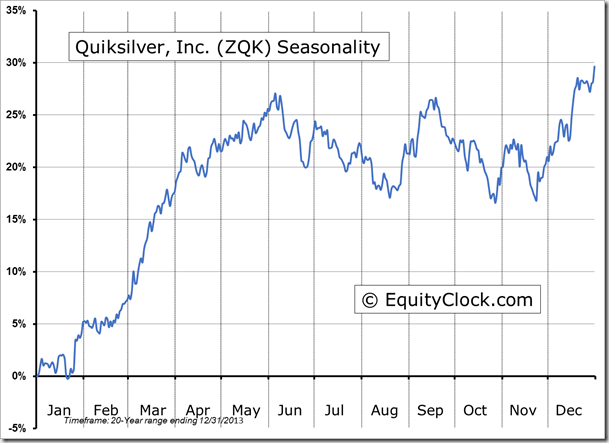
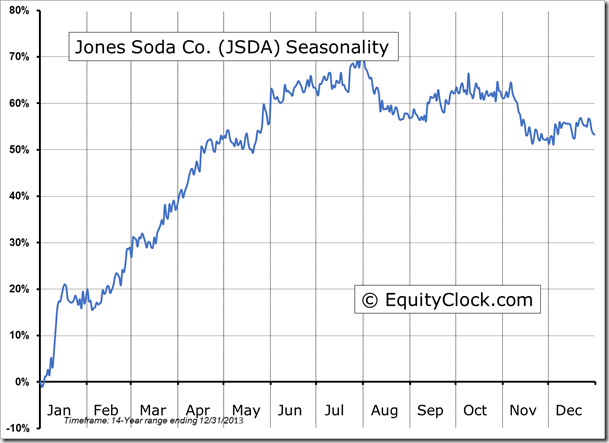
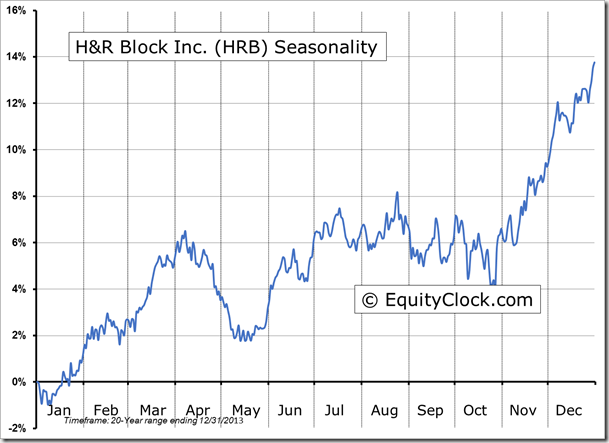
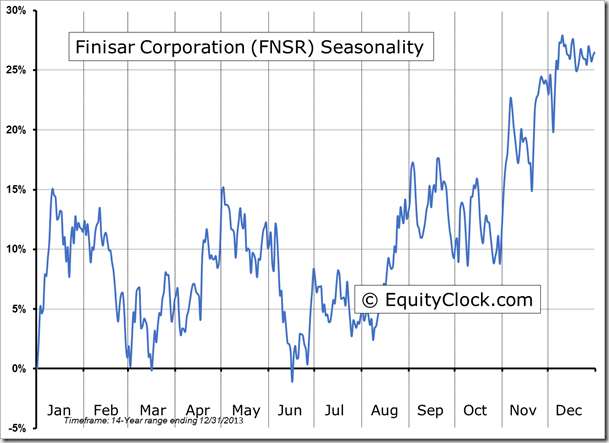
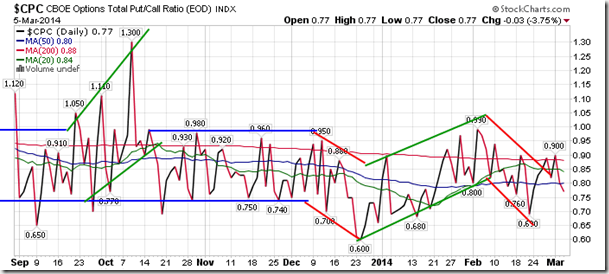
Sentiment on Wednesday, as gauged by the put-call ratio, ended bullish at 0.77. After a slight break of trend in a bearish direction coming into the month of March, the put-call ratio has turn back lower, leaning once again in a bullish direction as investors bet on further upside in equity prices.
S&P 500 Index
TSE Composite
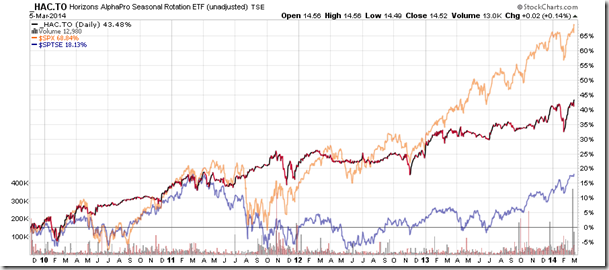
Horizons Seasonal Rotation ETF (TSX:HAC)
- Closing Market Value: $14.52 (up 0.14%)
- Closing NAV/Unit: $14.52 (up 0.07%)
Performance*
| 2014 Year-to-Date | Since Inception (Nov 19, 2009) | |
| HAC.TO | 1.54% | 45.2% |
* performance calculated on Closing NAV/Unit as provided by custodian
