Now is the time for traders to really pay attention to the rotation in the US Stock market as well as the continued price rotation in certain sectors. As we have been warning for the past few months, this really is a stock pickers market. Take a minute to review our past articles highlighting these sector moves and the general market sentiment over the past few weeks: June 24: Could A Big Move In The Global Markets Be Setting Up? and Q2 GDP vs. Technology Concerns vs. Foreign Markets. As traders, we need to understand how capital migrates toward opportunities and safety and how it migrates away from risk and price collapse.
Over the past months, our research team at Technical Trades has been pouring over the charts to identify these moves and to keep our subscribers ahead of these trends. The US dollar and the recent Q2 earnings season reporting have acted like pouring fuel onto a burning fire. BOOM. We highlighted the potential for increased volatility and price rotation weeks ago and we continue to try to identify the best opportunities for our subscribers.
Today, our research has really paid off with moves in sectors that we’ve highlighted and been trading for weeks. Our proprietary price modeling systems have shown us what to expect in the markets going forward many weeks and months. We’ve been calling for the NQ to hover near 7400 while we’ve been expecting the DOW and S&P 500 to continue to rally higher. We’ve been sharing our research that we believe the Transports, Russell and many of the Blue Chips will perform much better than the hot technology sector and others and its starting to happen now.
Capital Migration
Capital appears to be migrating out of technology on weakness and expected continued pricing pressures and that capital will be attempting to find new sources of security and growth. Earnings numbers have been generally strong, therefore, we expect this capital to migrate into stronger, dividend-producing and transportation-based equities. With the 4.1% GDP number, the expectations going into the end of this year should be that the economy may stay hot and these sectors could continue to rally.
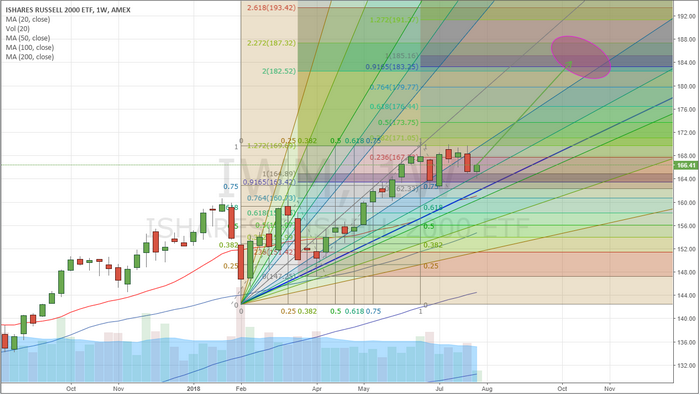
This Weekly IWM Chart shows dual Fibonacci extension levels that coincide near $184. These levels show us that the upside potential for this move in the Russell 2000 ETF, which is really only an 8~10% price rally) could accelerate upward throughout the end of this year as the US economy continues to push harder and the migration of capital continues to roll out of the hot technology sector and into more traditional ones.
We’ve highlighted the projected price point where this targeted level seems to be a key element of our analysis. This level also coincides with key Fibonacci price projection points. It makes sense to us that as capital moves out of technology and other risky sectors, this capital will be seeking a safe and secure investment in stocks that have the opportunity to perform well throughout the end of the year with a strong US economy. Retail, Transportation, the Russell 2000 and more traditional Blue-Chip equities seem to be the renewed targets for this capital.

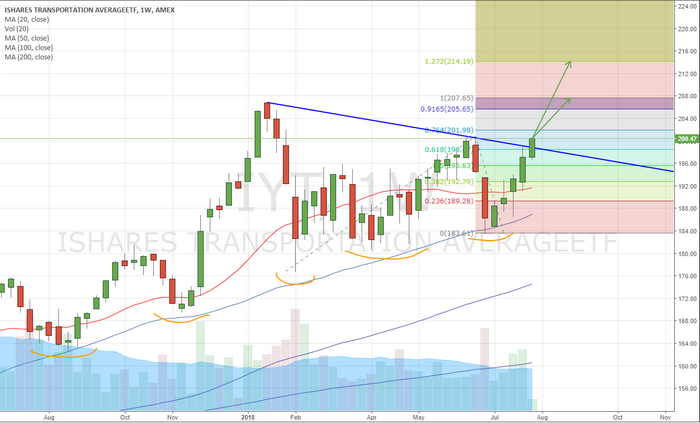
This Weekly chart of the IYT (Transportation ETF) shows the continued higher low price rotation patterns that have driven continued rallies in price. The last three low price rotations were key to setting up a new Pennant Formation Breakout that has just started. This breakout pattern is key to understanding the upside potential for the Transportation Index. These upside targets are 3.6% and 6.8% higher than current prices. This represents a very solid opportunity for traders over the next 4+ months as we head into the Christmas and Thanksgiving holidays – aka the 'Santa Rally.'

What was hot over the past 4+ months may start to flatten out and rotate lower over the next few as capital migrates into newer opportunities headed into the end of 2018 with a strong US economy. Our opinion is that technology will become a weakening market sector for at least the next 30~60 days as revisions to earning and expectations, as well as continued issues from China and globally, drive a capital re-balancing process across the globe. This migration of capital will move into new, more traditional equities as a source of security and growth. Capital always tries to find the best environment for security, growth and limited risk.
For example, we just locked in a 12% profit on the financial sector using FAS and we feel it is still headed higher. All this happened while technology stocks sold off.
