Over the past couple of weeks investors and traders have been growing increasingly bearish about the US stock market. While I too feel this rally is getting long in the teeth, there is no reason to exit long positions and start shorting.
My followers know I do not pick tops and I do not pick bottoms. This I explained in great detail in my previous post. There are more cons to that tactic and on several different levels (timing, volatility, emotions, lack of experience, addiction) than there are pros.
Keeping things simple on the broad market - short and to the point is my thinking for today and this week. Remember my analysis is 100% technical using price, volume, cycles, volatility, momentum and sentiment. I try not to let any emotions, gut feel, or bias flow into my projections. I say “TRY” because I am only human and at times when the market and emotions are flying high they still take control of me but those instances are few and far between.
So let’s get to the charts, shall we:
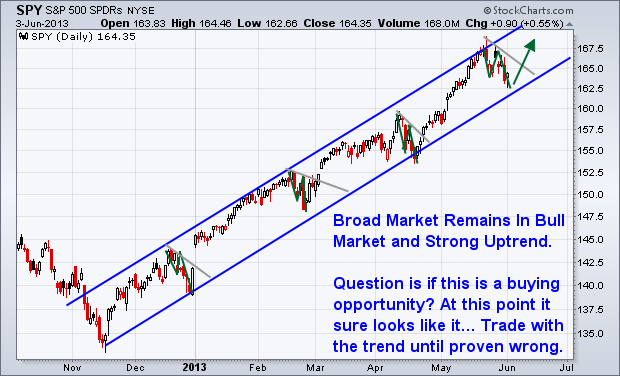
S&P 500 Index Trading Daily Chart – SPY Exchange Traded Fund
The S&P 500 index continues to hold up within its rising trend channel and the recent pullback is bullish. Remember the trend is your friend and it can continue for very long periods of time ranging from days, weeks, and even months…
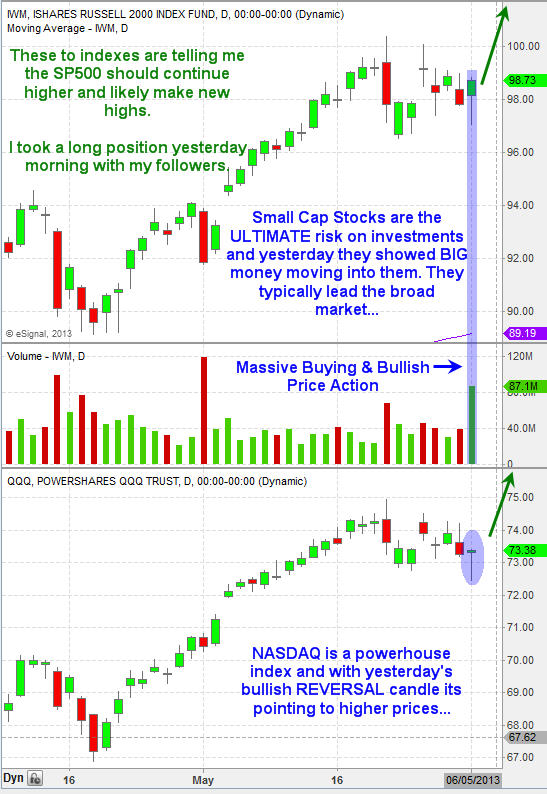
The US Stock Market MUSCLE Indexes
The charts below show and explain my thinking. However, in short, we need these two indexes to be strong if we want to see another major leg higher in the SPY, or to at least test the recent highs.
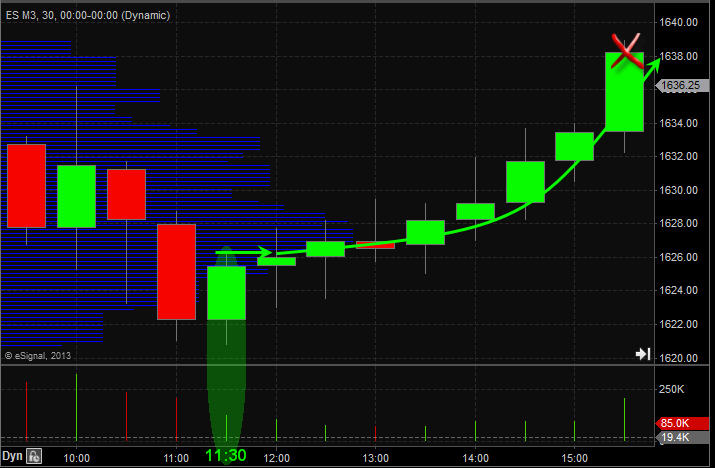
Yesterday the market opened slightly higher and pushed up in the first 30 minutes with strong volume. Overall the market looks as though it needs a day pause/pullback before taking another run higher.
Small cap stocks are the ULTIMATE Risk-On play and generate ridiculous gains in very short periods of time.
Bullish Index Price, Volume and Candles
The S&P 500 has been very predictable the past couple weeks for both intraday trading during key reversal times in the market when price has pullback to a support zone, and also for swing trading. Last week we bought shares of the ProShares Ultra S&P 500 ETF (SSO) when the market pulled back and we exited the next day for a 3.5% profit.
Yesterday was a perfect intraday example with the S&P 500 bottoming out at 11:30am in my time zone with price trading at support. Price then rallied into the close, posting a 12 point gain on the S&P 500 futures for a simple momentum play pocketing $600.
US Stock Market Mid-Week Conclusion:
In short, I still like stocks as the place to be and will not get bearish until proven wrong. Once price reverses and the technical clearly paint a bearish picture with price, volume, momentum, cycles and sentiment will I start shorting the bounces.
This week is a pivotal one for the stock market so expect increased volatility and possibly lower lows still until the counter-trend flushes the weak positions out before moving higher.
- English (UK)
- English (India)
- English (Canada)
- English (Australia)
- English (South Africa)
- English (Philippines)
- English (Nigeria)
- Deutsch
- Español (España)
- Español (México)
- Français
- Italiano
- Nederlands
- Português (Portugal)
- Polski
- Português (Brasil)
- Русский
- Türkçe
- العربية
- Ελληνικά
- Svenska
- Suomi
- עברית
- 日本語
- 한국어
- 简体中文
- 繁體中文
- Bahasa Indonesia
- Bahasa Melayu
- ไทย
- Tiếng Việt
- हिंदी
US Stock Market Foreshadows Yet Another Rally
Published 06/05/2013, 02:12 AM
Updated 07/09/2023, 06:31 AM
US Stock Market Foreshadows Yet Another Rally
Latest comments
Loading next article…
Install Our App
Risk Disclosure: Trading in financial instruments and/or cryptocurrencies involves high risks including the risk of losing some, or all, of your investment amount, and may not be suitable for all investors. Prices of cryptocurrencies are extremely volatile and may be affected by external factors such as financial, regulatory or political events. Trading on margin increases the financial risks.
Before deciding to trade in financial instrument or cryptocurrencies you should be fully informed of the risks and costs associated with trading the financial markets, carefully consider your investment objectives, level of experience, and risk appetite, and seek professional advice where needed.
Fusion Media would like to remind you that the data contained in this website is not necessarily real-time nor accurate. The data and prices on the website are not necessarily provided by any market or exchange, but may be provided by market makers, and so prices may not be accurate and may differ from the actual price at any given market, meaning prices are indicative and not appropriate for trading purposes. Fusion Media and any provider of the data contained in this website will not accept liability for any loss or damage as a result of your trading, or your reliance on the information contained within this website.
It is prohibited to use, store, reproduce, display, modify, transmit or distribute the data contained in this website without the explicit prior written permission of Fusion Media and/or the data provider. All intellectual property rights are reserved by the providers and/or the exchange providing the data contained in this website.
Fusion Media may be compensated by the advertisers that appear on the website, based on your interaction with the advertisements or advertisers.
© 2007-2024 - Fusion Media Limited. All Rights Reserved.
