Nasdaq 100


Nasdaq 100: 2253.86
Short-Term Trend: sideways
Outlook:
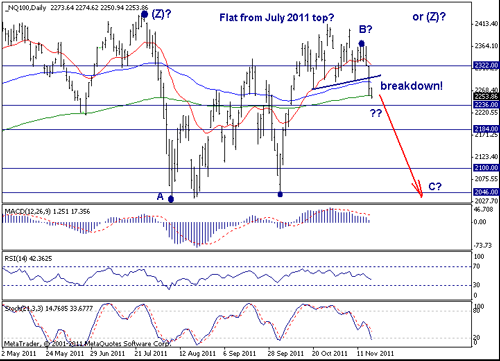
Last week I favored a long position on a pullback against the 2285 level. Well, I was wrong. The market broke firmly below the 2285 level and the immediate focus shifted on the downside. While the count presented a week ago is still valid (and if the market rallies this week, it will become preffered again), the odds right now have shifted in favor of the more bearish scenario presented above. It is actually the count that I used in August in September before the big advance in October. It implies that the uptrend from the Mar 2009 low ended earlier this year in July. And since late July a Flat pattern is under way. If correct, we will soon see weakness to new lows below 2040. A decline below 2185 will virtually confirm this outlook.
If the market manages to hold abv 2185 and then rallies back abv 2370, then the previous bullish count will be resurrected.
S&P500
S&P500: 1215.86
Short-Term Trend: sideways
Outlook:
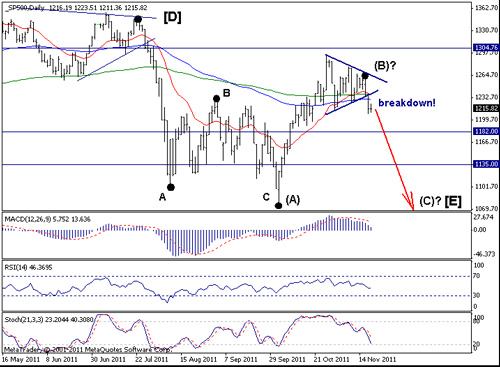
Well, I was bullish last week, but the things changed completely with the big sell-off on Wednesday and Thursday. Now, the daily chart is quite negative for the very short-term, but we can also say that a larger sideways consolidation from this year's top is under way. A move below 1182 will confirm this view and will suggest weakness twd this year's low at 1075.
On the upside, only a move abv 1265 will revive the previous bullish outlook. With this in mind, one can favor a short position as long as this level holds as resistance.

