In this issue:
US small-cap stocks continue to rally
It’s Been A Good Year For Global Asset Allocation Strategy Benchmarks
Managed Volatility Still Running Hot This Year
Small-cap stocks delivered an early Christmas gift: US shares in the small-cap realm posted the strongest gain during the shortened Christmas trading week. At the Dec. 24 close, iShares Core S&P Small-Cap (NYSE:IJR) was up 1.3% for the trading week – well ahead of the rest of the field for our list of proxy ETFs representing the major asset classes on a global basis.
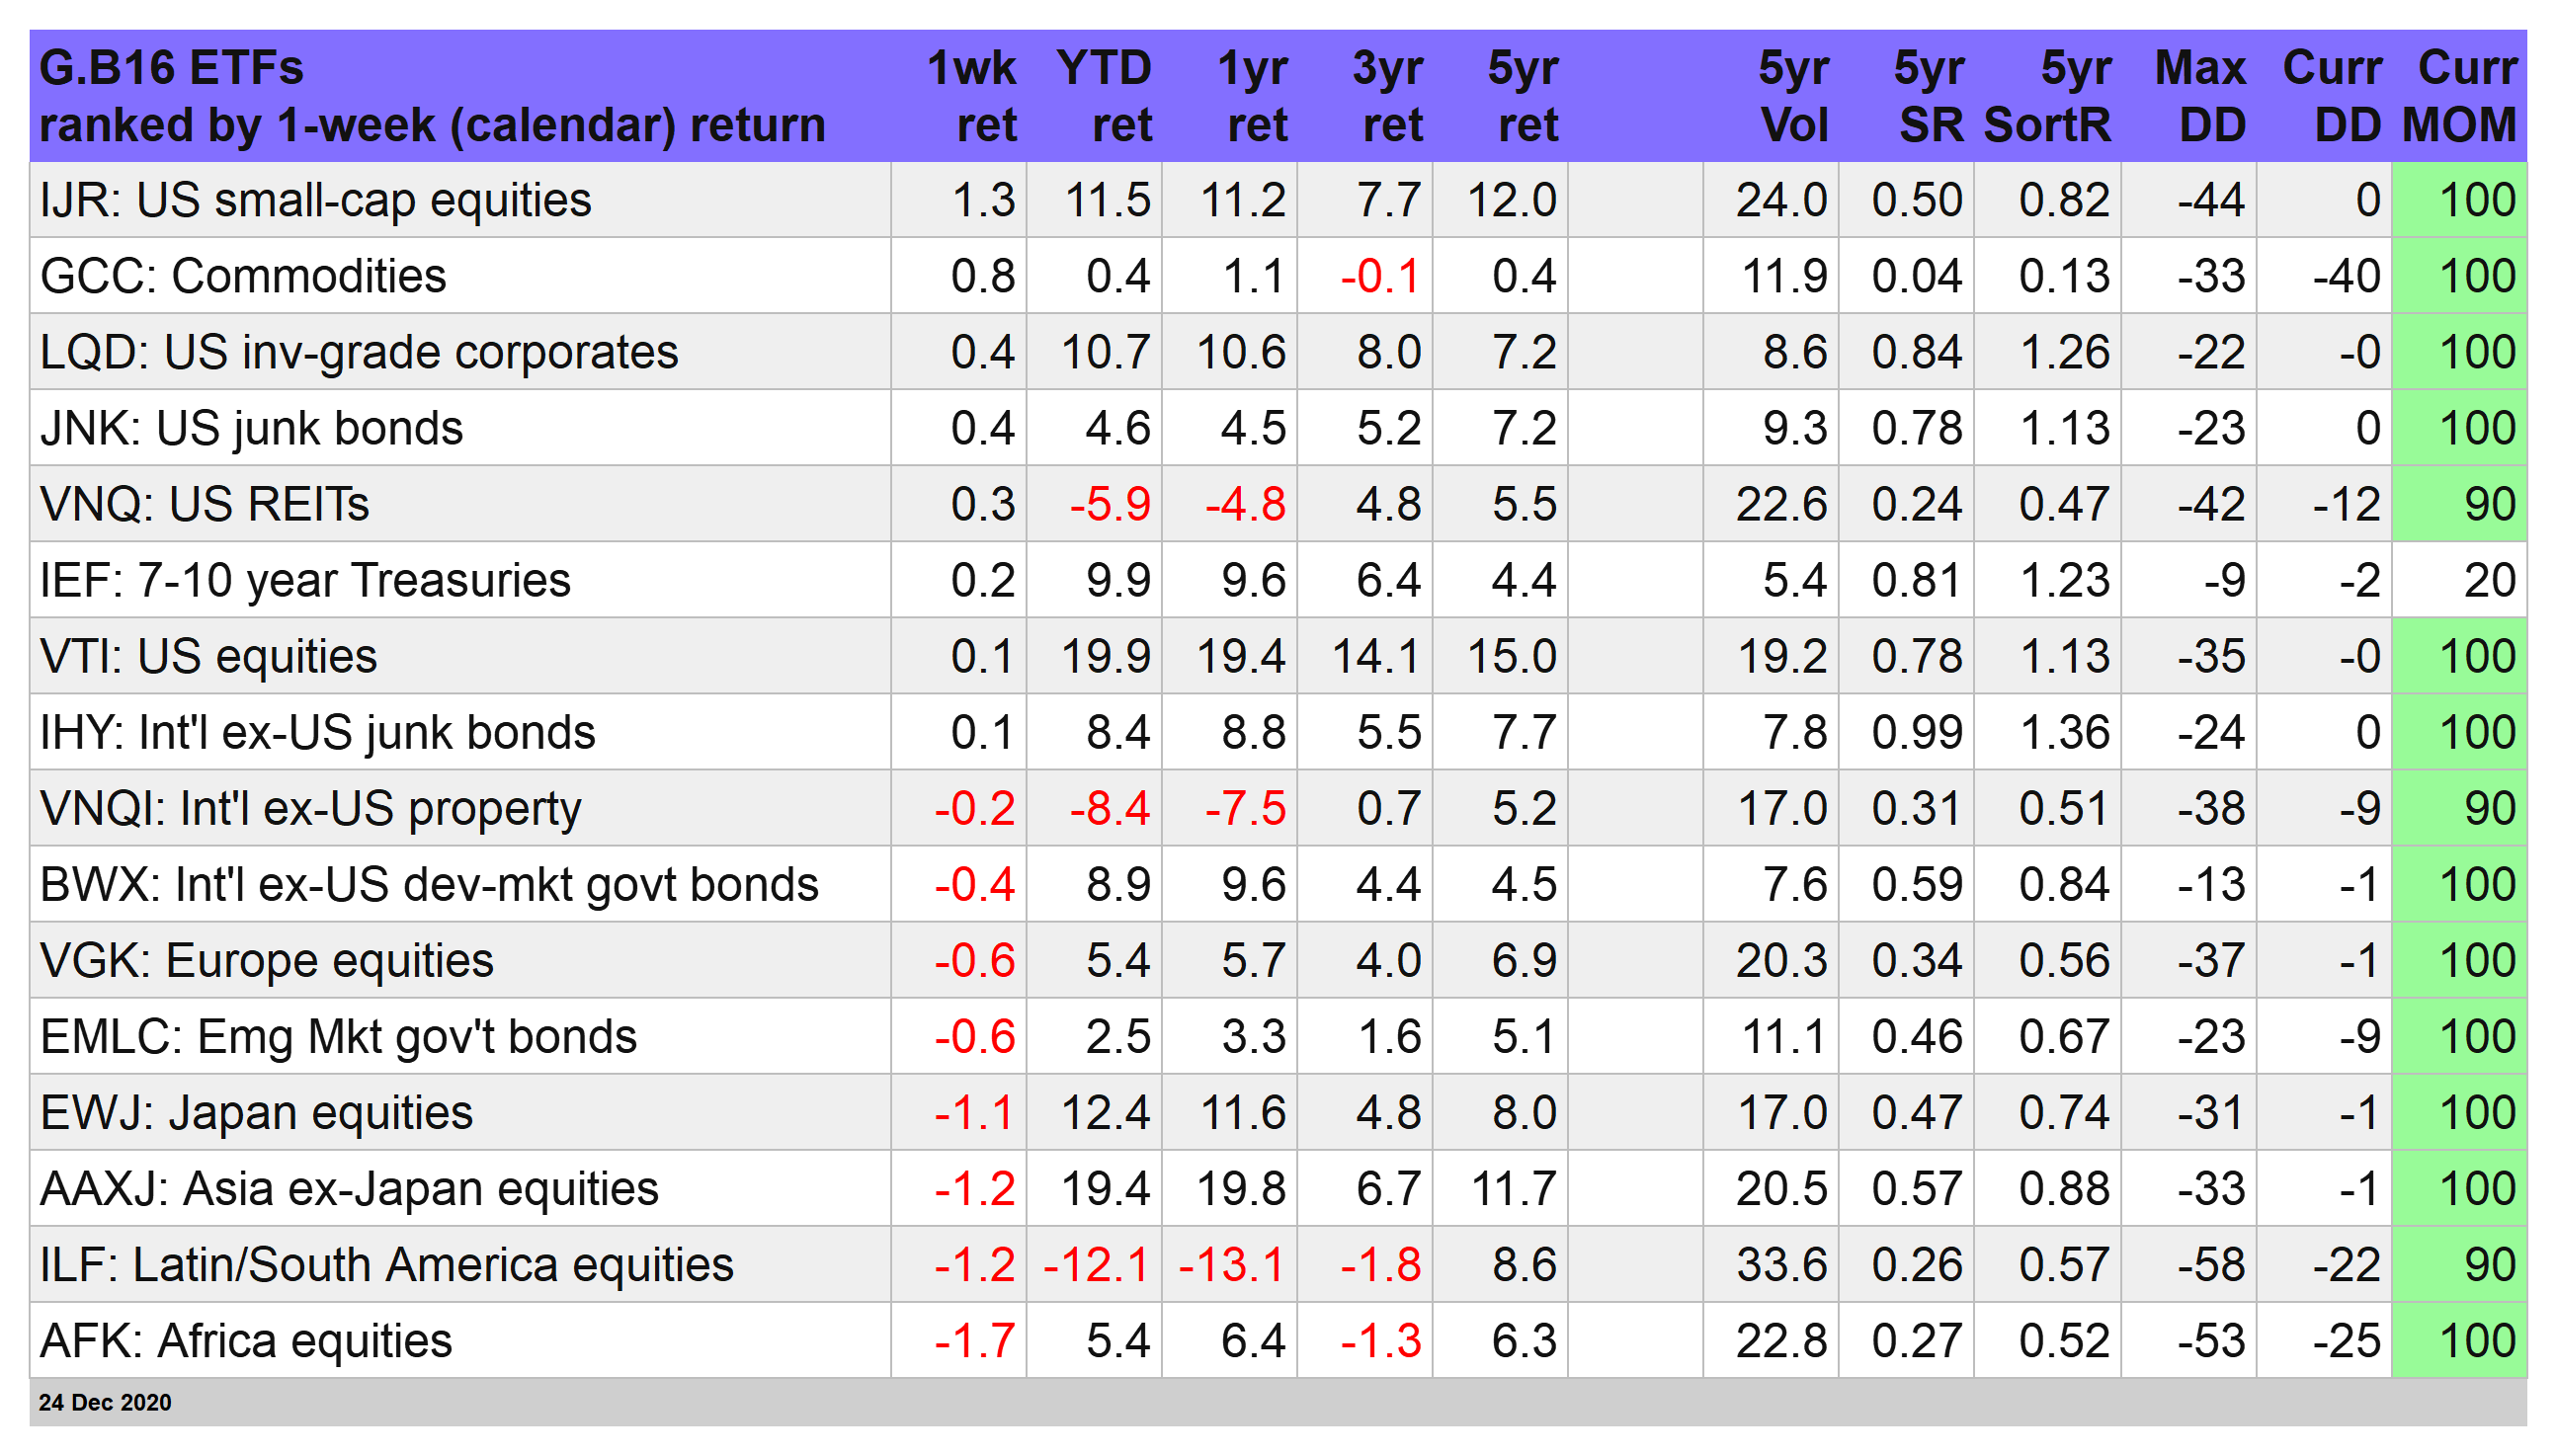
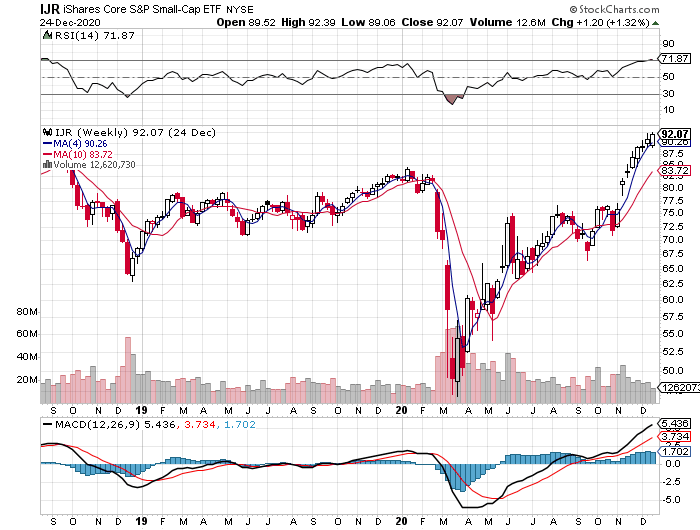
IJR’s 1.3% gain marks the seventh straight weekly advance. The rise lifted the fund to a record close. Year to date, IJR is up 11.5% on a total-return basis, which is fourth in line for the best 2020 performance for the asset classes in the table above.
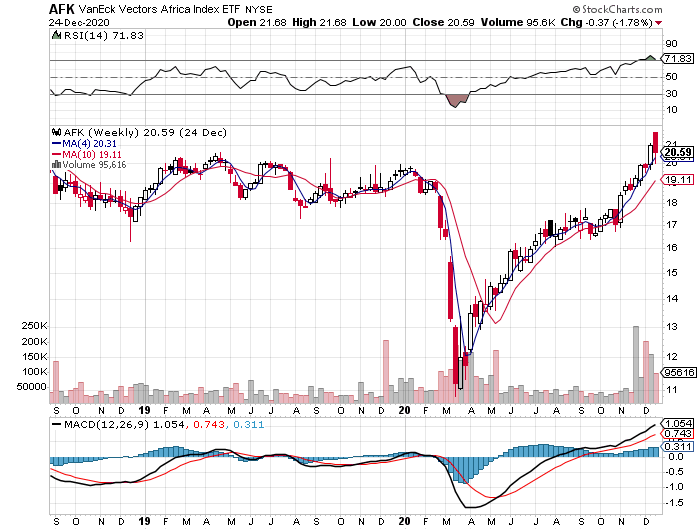
Overall, last week delivered mixed results for major asset classes, with gains and losses evenly divided for our global opportunity set. The deepest setback during Christmas week was posted by VanEck Vectors Africa (NYSE:AFK), which slumped 1.7%. The pullback isn’t all that surprising in the wake of the fund’s strong rally of late. AFK in recent weeks has been a leading performer, and at times leading the rally in risk assets, and so a round of profit-taking was arguably overdue after an extended run.
With one final, shortened trading week to go for 2020, the bias for gains in most asset classes stands out as a leading theme for the year. With the exception of US and foreign property shares ((NYSE:VNQ) and (NASDAQ:VNQI), respectively), along with Latin America stocks (ILF), gains dominate for the year-to-date column.
Given this backdrop, no wonder that current drawdowns tend to be zero or within shouting distance of nada. Barring a sudden fall from grace in the final run for 2020, the year is set to fade into the history books with a strong upside bias in most corners of risk assets.
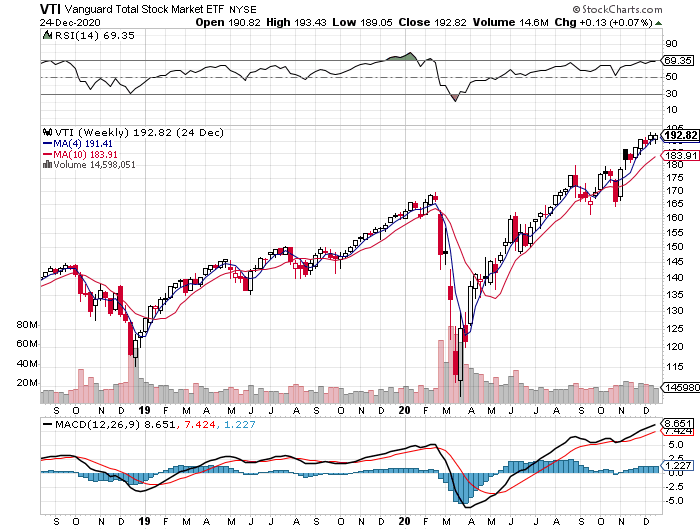
The year’s strongest year-to-date gain (still) is a broad measure of US stocks. Vanguard US Total Stock Market (VTI) is up nearly 20% in 2020 through Dec. 24, the bleeding edge for rallies this year, based on our breakout of asset classes via the G.B16 table above.
It’s Been A Good Year For Portfolio Strategy Benchmarks: A rising tide for asset classes continues to lift all asset allocation benchmarks as 2020 moves into the final stretch.
At the front of the line: the US 60/40 stock/bond yardstick, which is up 14.9% year to date. Broader measures of global risk assets are trailing that performance, but only moderately so. The softest year-to-date gain for the asset allocation benchmarks: Global Beta 5 (G.B5), which tracks the global opportunity set via five ETFs. (For details on all the risk metrics as well as the strategies and benchmarks, see this summary.)
Our broadest benchmark of the major asset classes — Global Beta 16 (G.B16), which reflects 16 slices of world markets — is doing a bit better with an 11.3% increase in 2020.
Overall, the key message via the asset allocation yardsticks: You had to work overtime to lose money this year with multi-asset-class strategies.

Managed Volatility Results On Track For a Sizzling 2020: A dynamic approach to asset allocation based on analyzing return volatility remains the top-performer by far for our trio of proprietary strategies.
Global Managed Volatility (G.B16.MVOL) is up more than 30% this year, well ahead of the other two quant-based active strategies in our wheelhouse. G.B16.MVOL, which opportunistically targets the G.B16 funds, sidestepped most of the market corrections in the spring; at the moment, the strategy remains full-out risk-on on all fronts.
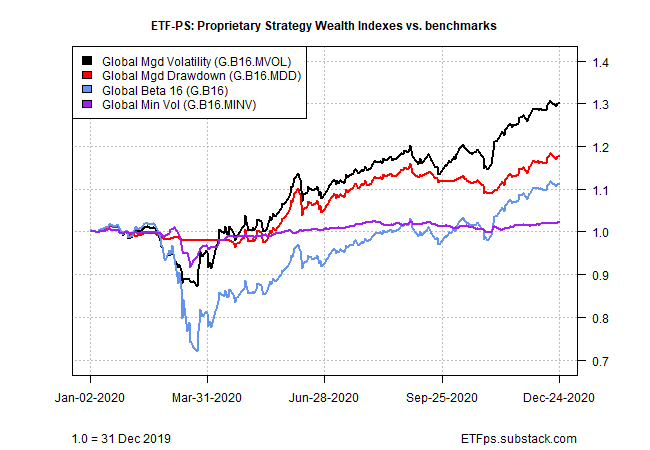

Global Managed Drawdown (G.B16.MDD), by contrast, turned a bit more cautious this past week after three slices of global markets shifted to risk-off for the fund: Asia ex-Japan equities (AAXJ), Japan equities (EWJ), and foreign government bonds in developed markets (BWX). The trio joined the long-running risk-off posture in US Treasuries (NASDAQ:IEF), bringing the total to four fund buckets currently allocated to cash (SHV) for G.B16.MDD.

BlackRock’s four asset allocation strategies are set to post respectable gains for 2020. At the moment, the aggressive mix is leading the way with a near-12% year-to-date increase.

With just four trading days left for the year, the odds look favorable for 2020 to go into the history books as one of the more volatile but profitable years in recent history. The road ahead may be a riddle wrapped in a mystery inside an enigma, but for most investors, 2021 will begin with a bullish tailwind blowing across the global markets.
