
Yesterday, the US retail sales showed solid results for October, as consumers increased their spending before the holiday season. Today we received Great BBritain'sheadline and core inflation numbers for October, both on a MoM and YoY basis. The EU is also set to deliver their final headline and core inflation figures on a MoM and YoY basis, which are expected to confirm the preliminary ones. Canada is also set to join UK and EU in releasing its inflation numbers for October.
US Shows Strong Retail Sales Figures
The US retail sales showed solid results for October, as consumers increased their spending before the holiday season. This increase could be explained because the country continues to battle the pandemic, and new restrictions might come in closer to Christmas. Also, due to increasing fuel prices, consumers fear a rise in energy costs, hence the intense buying activity at the pumps.
Sales of electronics and other electric appliances were one of the main drivers because those are seen as the most popular holiday gifts. The elevated buying activity could remain present unless the government decides to impose more restrictions.

British Inflation Rises Again
We received Great BBritain'sheadline and core inflation numbers for October, both on a MoM and YoY basis. All figures were expected to rise, apart from the core MoM one, as the initial projection for it was to stay at +0.4%. The core and headline MoM figures rose from +0.4% to +0.7% and from +0.3% to 1.1% respectively.
The YoY core reading went from +2.9% to +3.4% and the headline YoY one jumped from +3.1% to +4.2%. The latter one has not been at that level since December 2011. The increase came from a rise in utilities like fuel like gas and electricity.
Also, transportation and the hospitality industry saw increased costs, which are passed on to the consumer. The British pound reacted positively to the news and is seen higher against most of its major counterparts at the time of writing.

EUR/GBP – Technical Outlook
From around the middle of last week, EUR/GBP has been on a steep move lower while trading well below a short-term downside resistance line taken from the high of Nov. 5. Today, despite briefly falling below the lowest point of October, at 0.80402, the pair managed to climb back and stay above it. Although the near-term outlook seems to be bearish, we would prefer to wait for another drop below that hurdle to get comfortable with further declines.
A drop below the aforementioned 0.8402 zone may invite more sellers into the game. EUR/GBP could then fall to the 0.8388 obstacle or even to the 0.8355 level. That level marks the low of Feb. 26, 2020. Slightly below it lies another potential support area, at 0.8338, which is the low of Feb. 25, 2020.
Alternatively, a push back above the 0.8462 hurdle, marked by the low of Nov. 4, may lead the pair to a more significant correction higher, as some bears could get scared off temporarily. EUR/GBP may travel to the 0.8491 obstacle, a break of which could set the stage for a move to the 0.8520 zone. That zone marks the inside swing low of Nov. 9.

Together with the inflation numbers, Great Britain released its PPI input and output numbers for October. PPI input indicates the shift in costs for the manufacturer to purchase goods and raw materials, whereas the output reading shows the change in the price of the goods sold by the manufacturer. The input YoY figure rose from 11.9% to 13.0%, whereas the output number jumped from +7.0% to +8.0%.
Keeping An Eye On EEU'sFinal CPIs
The EU is also set to deliver their final headline and core inflation figures on a MoM and YoY basis, which are expected to confirm the preliminary ones. All are believed to come out the same as expected, apart from the headline MoM figure. That number is expected to rise from +0.5% to +0.8%. Now the reason for this might be that during the past month we have seen a sharp rise in demand for energy and food.
The latter had rapidly grown in price, as production costs have increased sharply due to climate change issues. In general, food production could remain under some negative pressure for quite a while, as demand for food remains high, but the EEarth'sresources for producing food is diminishing every year. We do not expect the euro to be heavily affected by these numbers.
Canada CPIs Are In Spotlight
Canada is also set to join UK and EU in releasing its inflation numbers for October. For now, there are no forecasts available for the core MoM and YoY figures, but the headline ones on the same basis could rise again. The expectations are for the YoY one to grow from +4.4% to +4.7% and for the MoM one to go from +0.2% to +0.7%.
If that's the case and the actual YoY figure comes out as expected, this may push inflation further away from the Bank of Canada (BoC) target range, between 1% and 3%. If CPIs continue to accelerate in the upcoming months, the BoC will have to start considering the idea of raising the interest rate earlier. The Canadian dollar could see an increase in volatility. However, it may remain primarily affected by the fluctuations in the price of crude oil.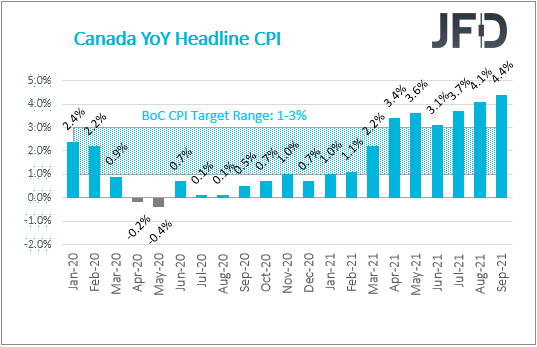
USD/CAD – Technical Outlook
USD/CAD is currently stuck between two short-term tentative lines, a downside one taken from the high of Nov. 12 and an upside drawn from the low of Oct. 27. To aim for the following short-term directional move, we would prefer to first wait for a breakout through one of those lines.
If the aforementioned downside line surrenders and the rate rises above the last wweek'shigh, at 1.2604, this will confirm a forthcoming higher high, possibly sending the pair further north. USD/CAD could travel to the 1.2648 obstacle, a break of which might set the stage for a move to the 1.2688 level. That level marks an intraday swing low of Oct. 1.
On the other hand, if the rate breaks through the previously mentioned upside line and falls below the 1.2473 territory, marked by an intraday swing high of Nov. 9, that could spook the bulls from the field for a while and send the pair lower. We will then aim for the 1.2425 obstacle, a break of which may lead USD/CAD to the 1.2387 area, which is the low of last week.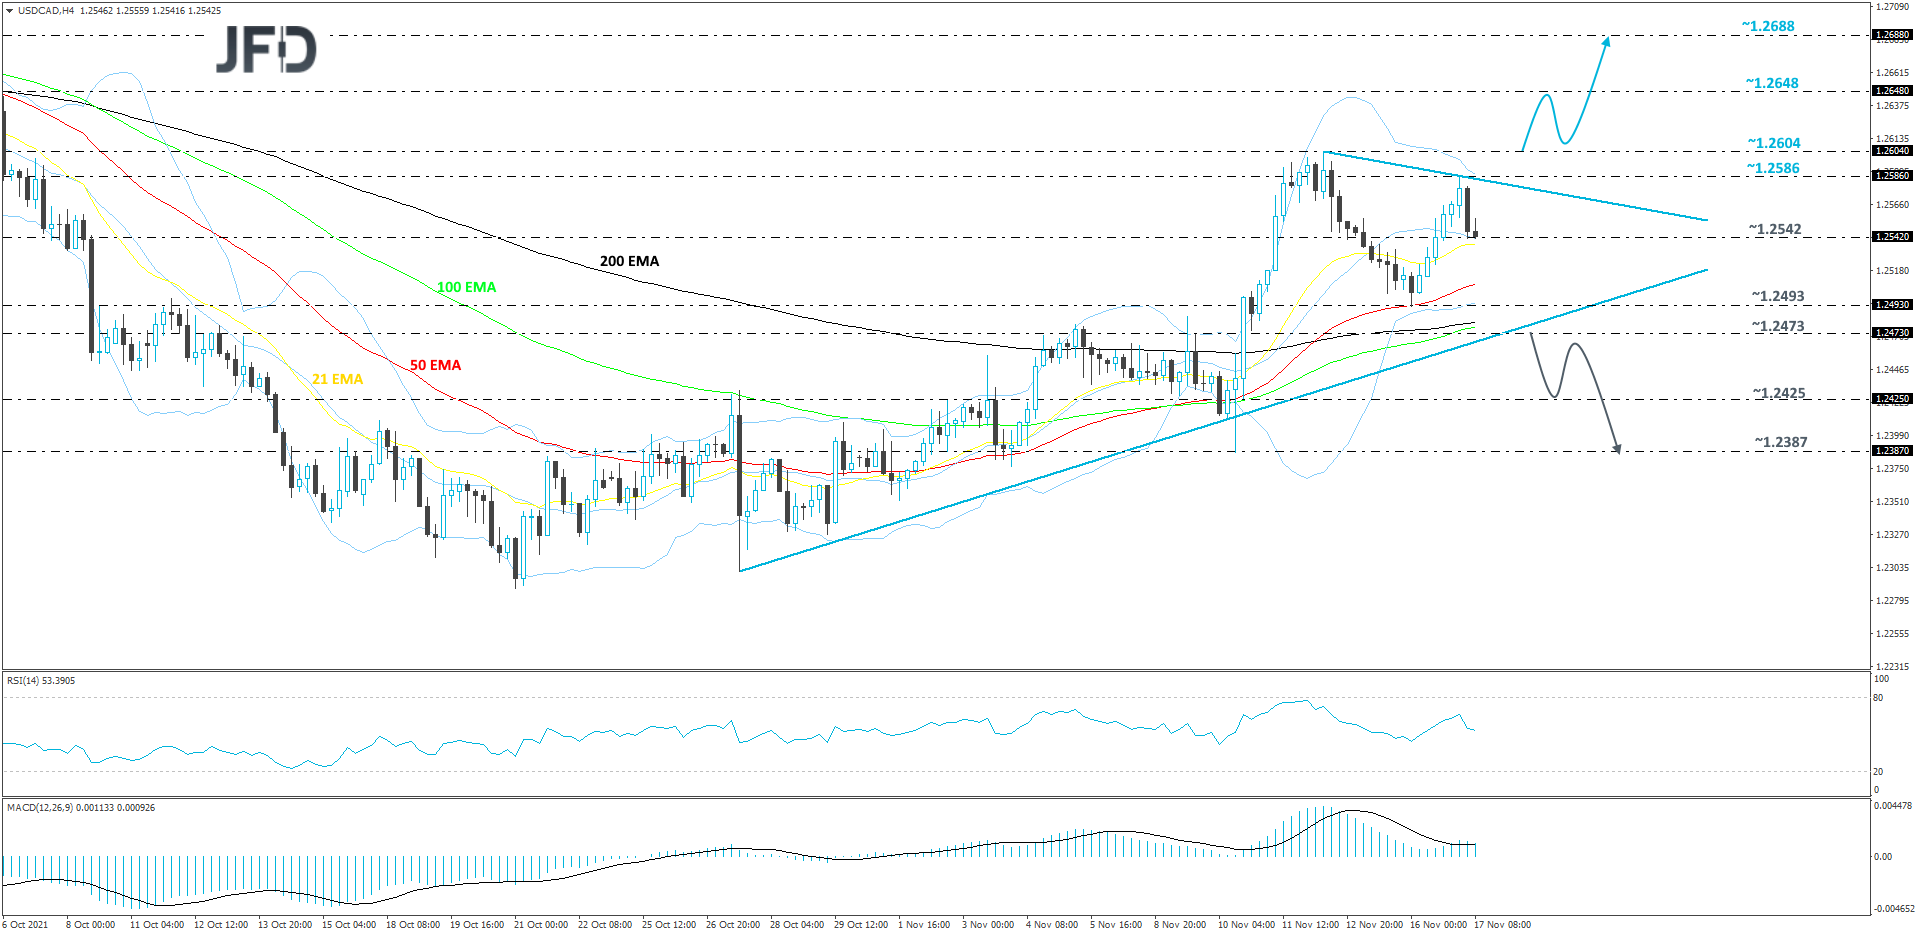
As for the Rest of Today's Events
The US will deliver its weekly crude oil inventories number, which measures the change in the number of barrels of commercial crude oil that US firms hold. The current expectation is for the number to increase from 1.001 million to 1.398 million barrels.