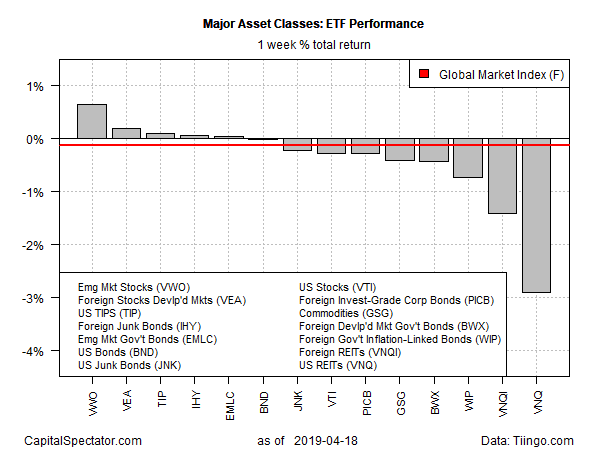
Real estate investment trusts (REITs) in the US tumbled last week, posting the biggest setback for the major asset classes during the shortened trading week that ended on April 18, based on a set of exchange-traded funds. The loss, the deepest for this corner of the market since a plunge late last year, follows a strong upside run for REITs in 2019.
Vanguard Real Estate (NYSE:VNQ) fell 2.9% last week, ending a bullish streak that lifted the ETF in nearly every week of the year. Despite the latest decline, VNQ’s 15.5% year-to-date performance remains one of the best performances for the major asset classes.
Last week’s biggest gain among broadly defined markets was in stocks listed in emerging markets. Vanguard FTSE Emerging Markets (NYSE:VWO) rose 0.6% and is currently near its highest price since last June.
Overall, a slight downside bias prevailed in asset prices last week, based on an ETF-based version of the Global Markets Index (GMI.F) – an investable, unmanaged benchmark that holds all the major asset classes (except cash) in market-value weights. GMI.F ticked down 0.1%, marking the benchmark’s first weekly decline in a month.
Despite last week’s setback for REITs, Vanguard Real Estate (VNQ) continues to hold the top one-year performance spot for the major asset classes. The ETF is up 17.6% on a total return basis for the trailing 12 months (252 trading days). The gain is well ahead of the second-best increase via US stocks: Vanguard Total Stock Market (Vanguard Total Stock Market (NYSE:VTI)) closed last week with an 8.6% advance compared with the year-earlier price after factoring in distributions.
The deepest one-year loss for the major asset classes: bonds issued by governments in emerging markets. VanEck Vectors J.P. Morgan EM Local Currency Bond (NYSE:EMLC) has shed 7.2% over the past year.
GMI.F continues to hold on to a modest one-year performance. The benchmark is currently up 2.7% for the trailing 12-month period.

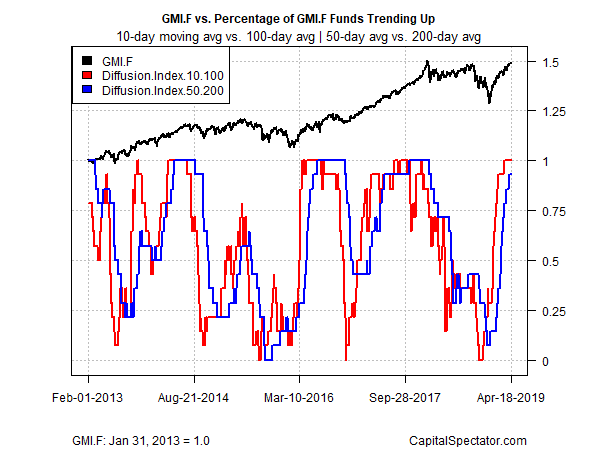
Profiling momentum for all the major asset classes based on two sets of moving averages continues to reflect a strong bullish bias for the ETFs listed above. The first definition compares the 10-day moving with the 100-day average, a measure of short-term trending behavior (red line in chart below). A second set of moving averages (50 and 200 days) offers an intermediate measure of the trend (blue line). The indexes range from 0 (all funds trending down) to 1.0 (all funds trending up). Based on data through last week’s close, bullish momentum remains robust overall.