
Equity indices rebounded yesterday, following a rebound in oil prices. Perhaps this was the result of hopes that major oil producers will expand or extend the already agreed production cuts. As for today, market participants may pay close attention to the US initial jobless claims for last week, as well as the Euro-area and US manufacturing and services PMIs for April.
EQUITIES GAIN AS OIL PRICES REBOUND
The dollar continued trading slightly higher against the majority of the other G10 currencies. It gained versus NOK, EUR, NZD, CHF and JPY in that order, while it underperformed versus GBP, CAD and AUD. The greenback traded virtually unchanged against SEK.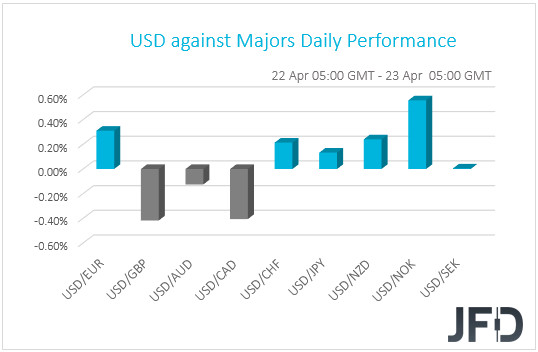
The performance in the FX sphere paints a blurry picture with regards to the broader market sentiment. The dollar remained relatively strong and the Kiwi slid, which suggests a risk-off mood. On the other hand, the Aussie gained, while the yen and the franc were slightly lower, which suggests otherwise. Therefore, we prefer to turn our gaze to the equity world in order to clear things up. There, major EU and US indices rebounded, ending their sessions in green territory, with the positive investor morale rolling into the Asian session today.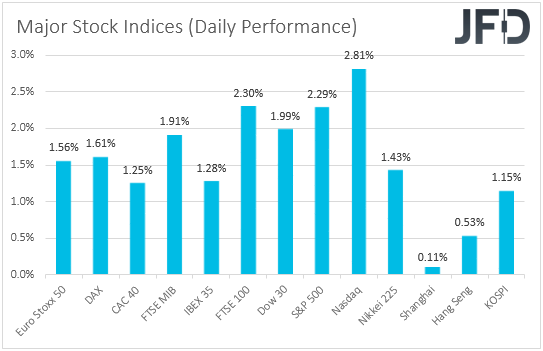
The driver behind the improvement in risk appetite was the same which was responsible for the risk aversion in the last couple of days, and this is oil. With no clear catalyst behind the move, oil prices rebounded yesterday, with WTI and Brent gaining 37.66% and 5.38% respectively. The recovery continued during the Asian session today as well. At the time of writing, both benchmarks are up 13.64% and 12.42%. Perhaps oil traders reinitiated long positions on hopes that the OPEC+ group will eventually decide to extend or even deepen its already agreed production cuts. Remember that the group has already agreed to cut supply by a record 9.7mn barrels per day starting on May 1st, and that on Tuesday, Saudi Arabia said that it is monitoring the market and is ready to take extra measures to stabilize prices.
The big question though is whether any extension or new cuts will be enough to offset the diminishing demand due to the coronavirus outbreak. With the restrictive measures around the globe still intact, demand may be set to stay subdued for a while more. Even if governments decide to start loosening their “stay at home” measures, this will probably be a slow procedure, which makes it unlikely for demand to return to its pre-virus levels soon. Thus, we cannot rule out another slide in oil prices if major producers disappoint energy participants. This may result in another round of risk-aversion, which means lower equity prices and commodity-linked currencies, and higher safe havens, like the dollar, the yen and the franc.
AUD/USD – TECHNICAL OUTLOOK
AUD/USD is slowly getting squeezed, as it continues to form a narrow descending triangle, clearly visible on our 4-hour chart. Although such patterns tend to break to the downside, we will stay cautiously-bearish for now, and wait for a break below 0.6265 hurdle, which is marked near the lows of April 16th and 21st, in order to examine slightly lower areas.
As mentioned above, if the rate slides below the 0.6265 hurdle, this would confirm the idea of a descending triangle pattern and also would confirm a forthcoming lower low. A few more bears might see it as a good opportunity to jump in and drive the pair to the 0.6213 obstacle, a break of which may set the stage for a slide to the 0.6115 level. That level marks the low of April 8th.
On the other hand, if AUD/USD pushes through the upper side of the triangle and also breaks above the 0.6397 barrier, marked by the high of April 20th, that may spark interest in the eyes of more buyers. The pair could then travel to the 0.6444 hurdle, which is the current highest point of April. The rate may get a hold-up around there, or even retrace back down a bit. That said, if it remains above the upper side of the previously-discussed triangle, then the bulls may take advantage of the lower rate and charge again. If this time the 0.6444 barrier surrenders and breaks, the next possible resistance area to consider could be near the 0.6539 level, marked by the high of March 11th.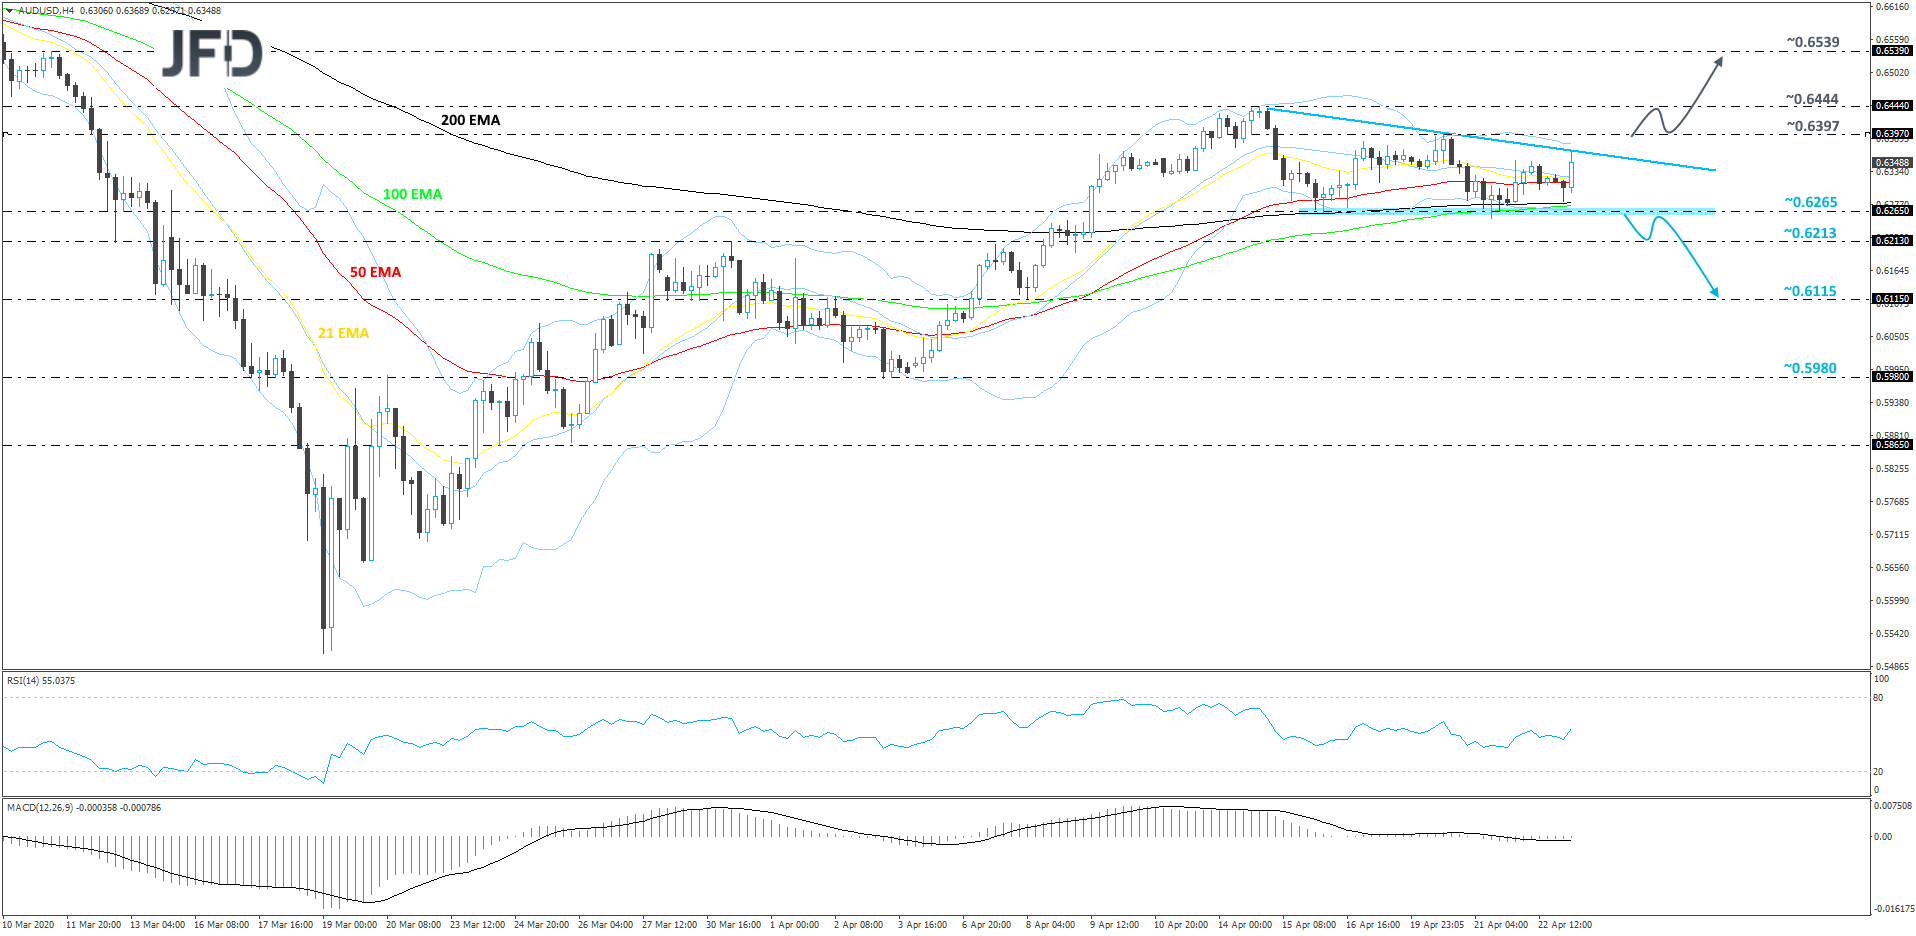
INITIAL JOBLESS CLAIMS AND APRIL PMIS ON INVESTORS’ RADAR
Speaking about the broader market sentiment, for another week, investors may pay extra attention to the US initial jobless claims for last week. The consensus is for another 4.2mn people signing up for unemployment benefits, following the previous week’s 5.245mn. Something like that would push continuing claims up to 16.176mn from 11.976mn and may prompt investors to reduce their risk exposure again, as this would signal that the wounds of the US labor market are really deep. As we noted in the past, paradoxically, the US dollar is likely to strengthen. Lately, the greenback has been reacting positively to disappointing US data, as it has been acting as a safe haven. In a dollar-denominated world, during periods of turbulence and uncertainty, investors prefer to liquidate their assets and hold cash instead.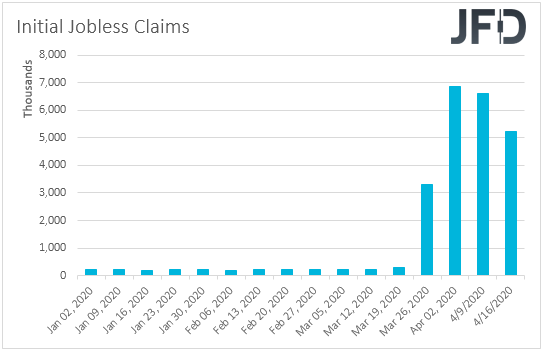
Apart from the initial jobless claims, we also get preliminary manufacturing and services PMIs for April from several Euro-area nations and the bloc as a whole, as well as the preliminary US prints. Both Eurozone’s manufacturing and services PMIs are expected to have declined further into the contractionary territory, to 39.2 and 23.8 from 44.5 and 26.4 respectively, something that will drag the composite index down to 25.7 from 29.7. In the US, the manufacturing index is expected to have slid to 38.0 from 48.5, while the services one is anticipated to have declined to 31.5 from 39.8.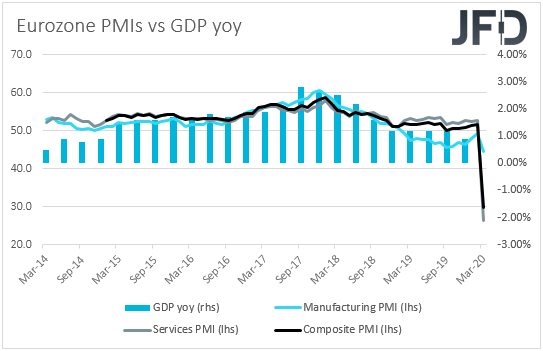
Another round of declines in the PMIs would enhance the view that the global economic wounds due to the fast-spreading coronavirus have dragged into the second quarter of the year. Last Thursday, ECB President Christine Lagarde said that she and her colleagues are committed to doing everything necessary within their mandate to fight the crisis, while on March 26th Fed Chair Powell highlighted that the Fed is not going to run out of ammunition in its attempt to stimulate the economy.
So, having all these in mind, a disappointing set of PMIs may raise speculation of even more easing by the ECB and the FOMC. The euro could slide alongside the Euro-area PMIs, but the dollar may be benefited due to its safe-haven status, despite the potentially weak US indices. As we already noted, the greenback has been performing well on disappointing US data recently and may continue to do so.
EUR/USD – TECHNICAL OUTLOOK
Looking at the technical picture of EUR/USD on our 4-hour chart, it looks like the pair is forming a possible descending triangle. Such patterns tend to be bearish, according to the TA rules. However, we need to see a clear break below the 1.0768 territory, which marks the lower side of the potential triangle, in order to consider lower areas. For now, we will take a cautiously-bearish approach.
Eventually, if EUR/USD falls below the 1.0768 hurdle, this will confirm a forthcoming lower low and more sellers could join in and drive the pair lower. The next potential support area to examine could be near the 1.0718 zone, which is an intraday swing low of March 23rd. That zone might be seen as a temporary obstacle on the pair’s journey south, so a break of it could set the stage for a slide to the 1.0636 level. That level is the lowest point of March.
Alternatively, if the rate somehow manages to break above the upper side of the aforementioned pattern and to rise above the 1.0893 barrier, marked near the highs of April 17th and 20th, such a move may signal a change in the short-term trend. EUR/USD could then drift to the April 14th high, at 1.0991. The pair could initially get a hold-up around there, but if the buyers are still feeling comfortable, a break of that territory would confirm another forthcoming higher high and could open the door for a test of the 1.1038 level. That level is the current highest point of April.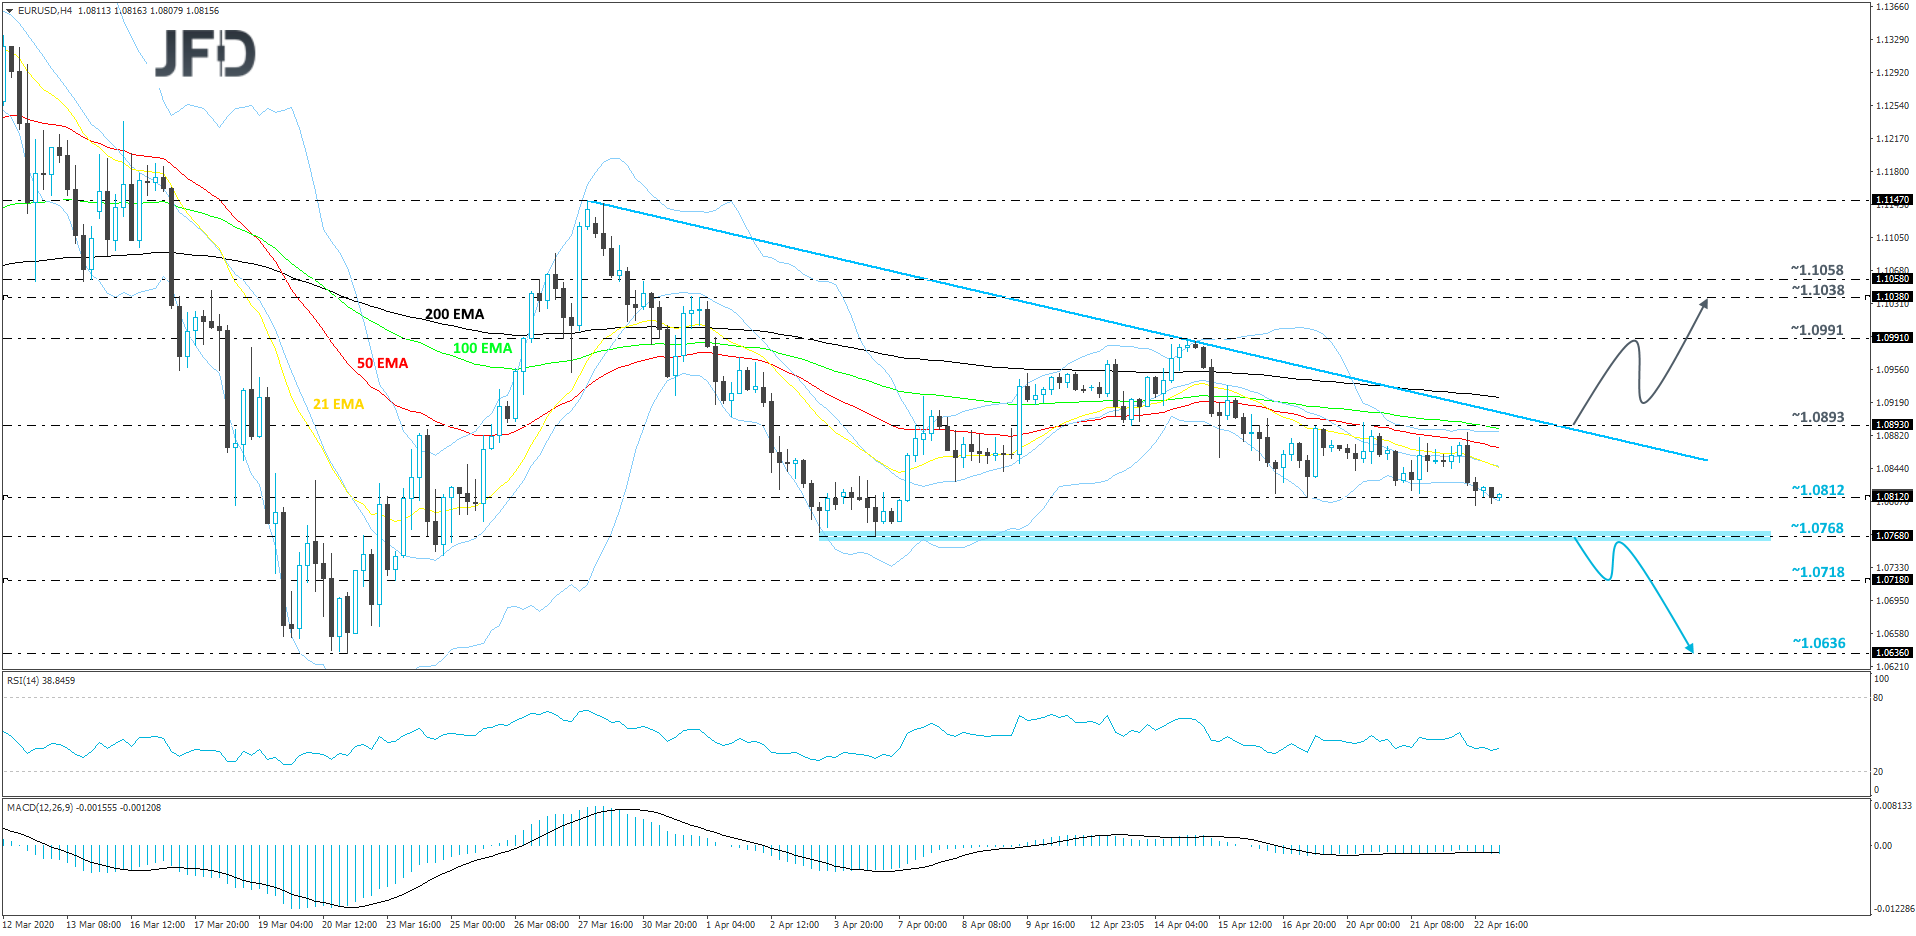
AS FOR THE REST OF TODAY’S EVENTS
With regards to the rest of the data on the agenda, we have the UK retail sales and the US new home sales, both for March. The UK headline retail sales are expected to have ticked down to +0.8% yoy from +0.9%, but the core rate is anticipated to have increased to +1.1% yoy from +0.5%. Nonetheless, bearing in mind that the yoy rate of the BRC retail sales monitor for the month slid to -3.5% from -0.4%, we see the risks surrounding the official figures as tilted to the downside. The US new home sales are forecast to have declined 2.2% mom after falling 4.4% in February.
As for tonight, during the Asian morning Friday, we get Japan’s National CPIs for March. No forecast is available for the headline rate, but the core one is anticipated to have declined to +0.4% yoy from +0.6%. The core Tokyo CPI rate ticked down to +0.4% from +0.5%, supporting the notion for a slide in the National core rate, while the headline Tokyo one held steady at +0.4%, suggesting that the National headline rate may have remained unchanged as well.
- English (UK)
- English (India)
- English (Canada)
- English (Australia)
- English (South Africa)
- English (Philippines)
- English (Nigeria)
- Deutsch
- Español (España)
- Español (México)
- Français
- Italiano
- Nederlands
- Português (Portugal)
- Polski
- Português (Brasil)
- Русский
- Türkçe
- العربية
- Ελληνικά
- Svenska
- Suomi
- עברית
- 日本語
- 한국어
- 简体中文
- 繁體中文
- Bahasa Indonesia
- Bahasa Melayu
- ไทย
- Tiếng Việt
- हिंदी
U.S. Jobless Claims And April PMIs Enter The Limelight
Published 04/23/2020, 03:44 AM
Updated 07/09/2023, 06:31 AM
U.S. Jobless Claims And April PMIs Enter The Limelight
3rd party Ad. Not an offer or recommendation by Investing.com. See disclosure here or
remove ads
.
Latest comments
Install Our App
Risk Disclosure: Trading in financial instruments and/or cryptocurrencies involves high risks including the risk of losing some, or all, of your investment amount, and may not be suitable for all investors. Prices of cryptocurrencies are extremely volatile and may be affected by external factors such as financial, regulatory or political events. Trading on margin increases the financial risks.
Before deciding to trade in financial instrument or cryptocurrencies you should be fully informed of the risks and costs associated with trading the financial markets, carefully consider your investment objectives, level of experience, and risk appetite, and seek professional advice where needed.
Fusion Media would like to remind you that the data contained in this website is not necessarily real-time nor accurate. The data and prices on the website are not necessarily provided by any market or exchange, but may be provided by market makers, and so prices may not be accurate and may differ from the actual price at any given market, meaning prices are indicative and not appropriate for trading purposes. Fusion Media and any provider of the data contained in this website will not accept liability for any loss or damage as a result of your trading, or your reliance on the information contained within this website.
It is prohibited to use, store, reproduce, display, modify, transmit or distribute the data contained in this website without the explicit prior written permission of Fusion Media and/or the data provider. All intellectual property rights are reserved by the providers and/or the exchange providing the data contained in this website.
Fusion Media may be compensated by the advertisers that appear on the website, based on your interaction with the advertisements or advertisers.
© 2007-2024 - Fusion Media Limited. All Rights Reserved.