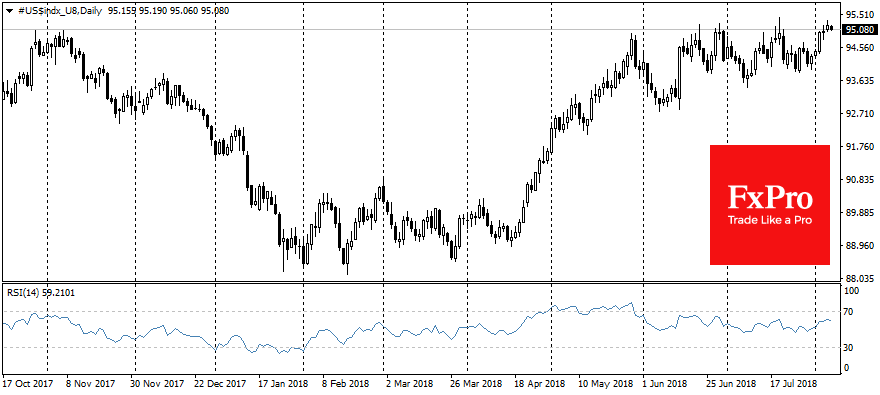
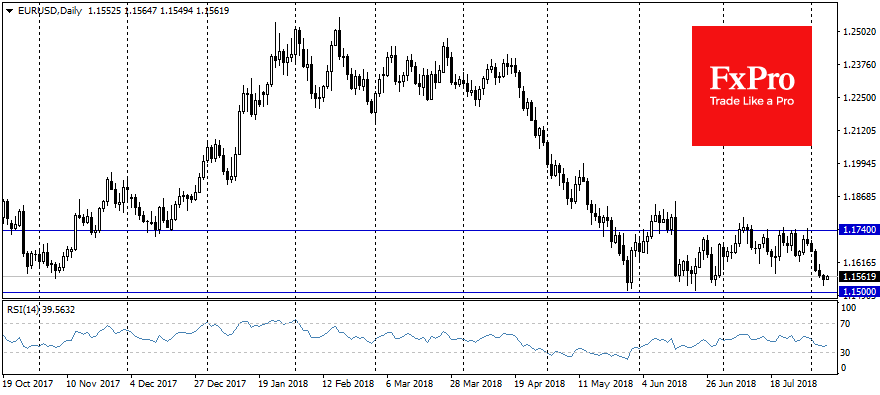
The demand for dollar, provoked by the fears of new US sanctions against a number of countries and expanding trade conflict with China push the American currency close to the upper edge of the trading range since April.

The threat of sanctions and tariffs from the United States puts pressure on a large part of developing markets. Chinese bourses are under pressure because of the threat of tariff wars. Iran is under threat of imposing sanctions because of Iranian nuclear programme. Russia is vulnerable because of suspicion about its interference in the elections. Turkey is under pressure because of the reluctance to release the American pastor. All these threats have already had an extremely negative impact on the business sentiments in the emerging markets, causing capital outflows and national currencies weakening.

The big question is whether such strengthening of the US dollar is favourable for the American economy or not. For the long-term distance the answer is simple – «No». This is exactly what the President and the U.S. Treasury Secretary have said in the past. Nevertheless, in the short–term the dollar’s growth could help to reduce the US inflationary pressure, avoiding even more abrupt tightening from the Fed. Moreover, it should not be forgotten that the American budget has a huge deficit, and the States actively attract market capital to finance it.
As one of many consequences, the USD receives additional demand due to the flow into the liquid U.S. Treasuries (UST), which is abundantly offered to the markets in order to finance the enormous fiscal deficit.
Coincidence or not, but the effect of the U.S. president’s active economic pressure on other countries is counterbalanced by the effect of the overgrown debt securities offer. As a result of the increased demand for safe-heavens, the yield for 10-years treasuries bond remains close to 3%, reluctant to grow higher, as it was widely expected earlier and despite the Fed Funds rate hikes and acceleration in inflation.
At the same time, strong macroeconomic data of the U.S. economy and company reporting support the positive dynamics of American stock indices. On Monday, S&P 500 added 0.3%, and the index futures add another 0.1% on Tuesday, reducing the gap from January’s historical highs to only 0.9%.

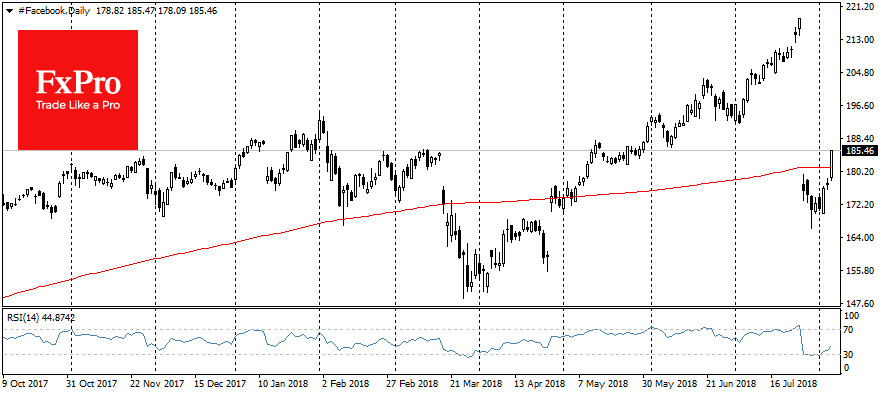
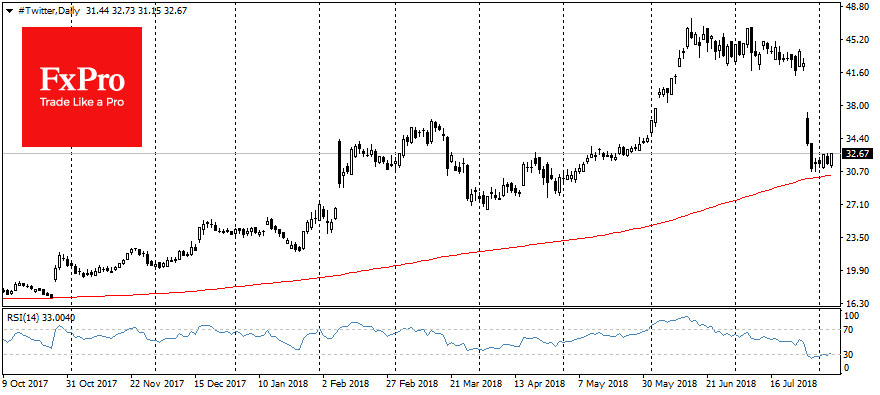
Among individual shares, it is worth noting the growth of Facebook (NASDAQ:FB) shares on Monday by 4.5%. In the recent days, the stocks had stabilized after a collapse and now attract investors who are betting on the rebound after an excessive decline. Taking an important line of 200-day moving average and exiting the oversold zone for RSI also support the bullish sentiment among those investors who look at technical indicators. Twitter shares have not turned to rally yet, but technical indicators demonstrate this possibility.

Alexander Kuptsikevich, the FxPro analyst
