Get 40% Off
🤯 Perficient is up a mind-blowing 53%. Our ProPicks AI saw the buying opportunity in March.Read full update

U.S. Dollar Index Likely To Make Grand Top In 2020

Published 01/11/2017, 11:09 PM
Updated 07/09/2023, 06:32 AM

The US dollar index which represents a measure of the value of the United States dollar relative to a basket of foreign currencies, keeps rising during the recent 6 years. Its value was around 71 in 2008, and now it's 101.75. But there are some major events related to this index ahead in the medium-term future. Look at the chart below.
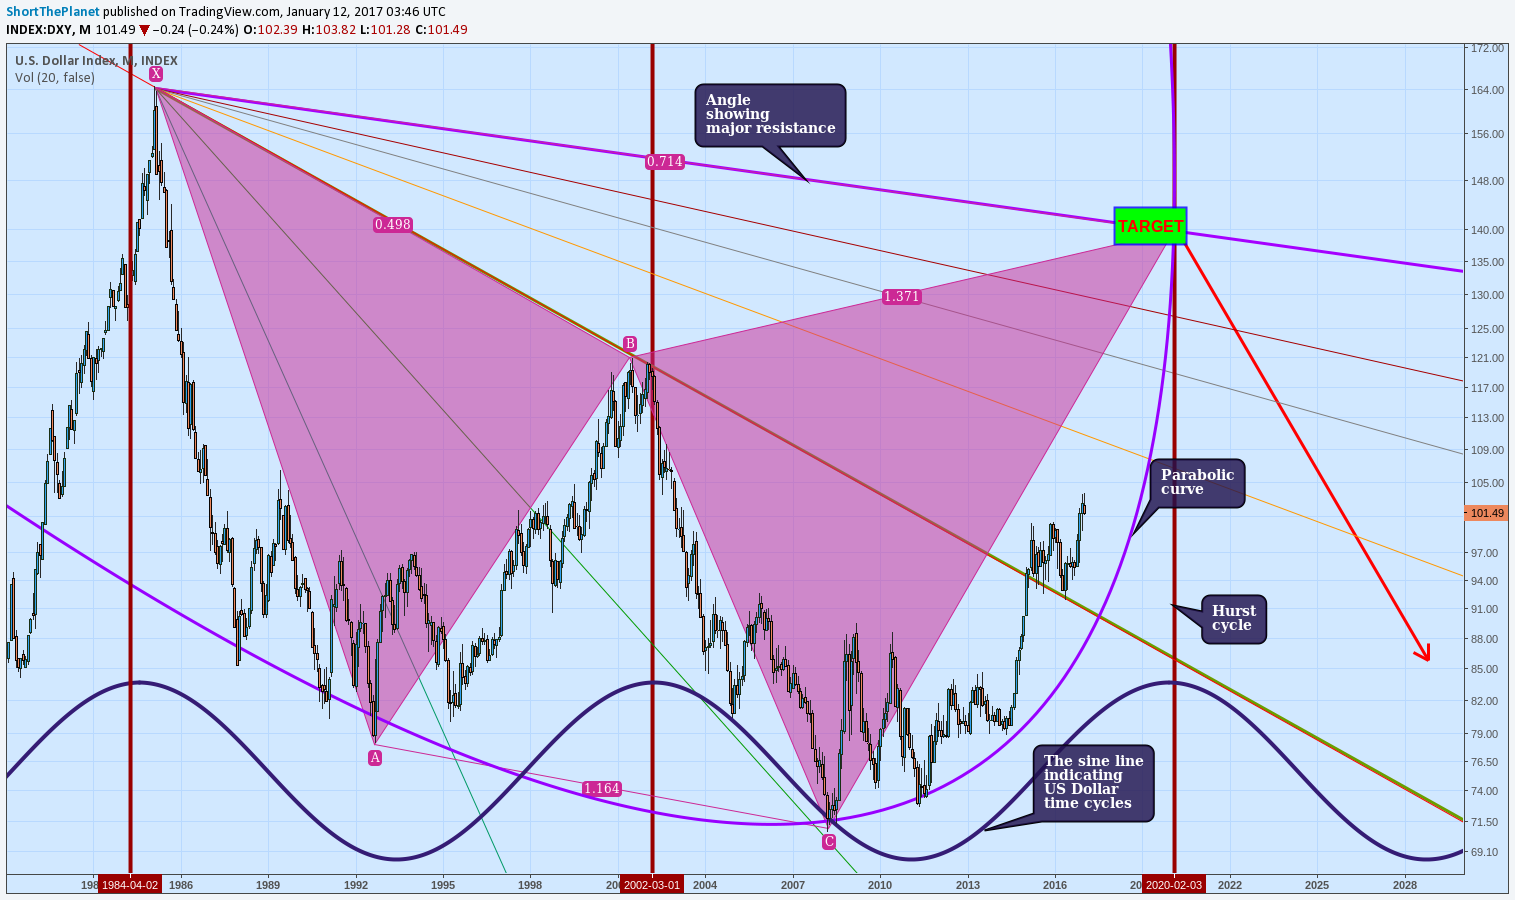
DXY Monthly Chart

As you can see, the target is 135-140 in the year 2020. Now I will explain why and what's going to happen after that.

Gigantic Bearish Cypher pattern is forming

This is really huge, a gigantic bearish cypher pattern has been forming since the year 1985, and it's going to be completed in 2020. Once it completes, a major trend reversal is likely to occur and the following downtrend's length will be comparable to the length of the formed pattern. Here is the pattern shown schematically:
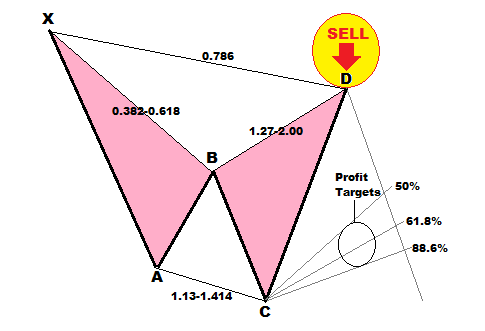
Giant Bearish Cypher Pattern

Hurst Cycles

The 18-year Hurst cycle going to finish in 2020 +/- 1 year. Traditionally most assets that are traded against the dollar make bottoms at the end of each cycle, and each asset has its own cyclical structure (i.e. key points at which the cycles begin and finish). But the dollar itself has an inverted cyclical structure, which means it makes tops at the end of each cycle.

By the way, the US dollar Hurst cyclical structure coincides exactly with the cyclical structure of the Dubai Financial Market index (DFMGI) shown in my article "The best time to invest in Dubai will be the year 2020", except for the fact that it's inverted.

3rd party Ad. Not an offer or recommendation by Investing.com. See disclosure here or remove ads .

Once it makes the next top in 2020, the following major downtrend should last at least 9 years.

Angle and sine line

The sine line on the chart above shows more precise structure of the price movements during the time cycles. Angle on my chart shows more accurate price target, which is, as said above, 135-140.

Latest comments

Risk Disclosure: Trading in financial instruments and/or cryptocurrencies involves high risks including the risk of losing some, or all, of your investment amount, and may not be suitable for all investors. Prices of cryptocurrencies are extremely volatile and may be affected by external factors such as financial, regulatory or political events. Trading on margin increases the financial risks.
Before deciding to trade in financial instrument or cryptocurrencies you should be fully informed of the risks and costs associated with trading the financial markets, carefully consider your investment objectives, level of experience, and risk appetite, and seek professional advice where needed.
Fusion Media would like to remind you that the data contained in this website is not necessarily real-time nor accurate. The data and prices on the website are not necessarily provided by any market or exchange, but may be provided by market makers, and so prices may not be accurate and may differ from the actual price at any given market, meaning prices are indicative and not appropriate for trading purposes. Fusion Media and any provider of the data contained in this website will not accept liability for any loss or damage as a result of your trading, or your reliance on the information contained within this website.
It is prohibited to use, store, reproduce, display, modify, transmit or distribute the data contained in this website without the explicit prior written permission of Fusion Media and/or the data provider. All intellectual property rights are reserved by the providers and/or the exchange providing the data contained in this website.
Fusion Media may be compensated by the advertisers that appear on the website, based on your interaction with the advertisements or advertisers.
© 2007-2024 - Fusion Media Limited. All Rights Reserved.