Stock market today: S&P 500 in weekly loss as trade war fears intensifyy

European shares traded lower yesterday, but sentiment improved during the US session, perhaps as initial jobless claims for last week and existing home sales for September came in better than expected.
Today, the preliminary PMIs for October may come under the spotlight, as they will provide a first picture of how major economies have performed during the month so far.
PMIs To Give A Glimpse Of Economic Performance In October
The US dollar traded higher against most of the other major currencies on Thursday and during the Asian morning Friday. It gained the most versus AUD, NZD, and CAD in that order, while it lost some ground only versus CHF and JPY.

The strengthening of the US dollar and the other safe havens, yen, and franc, combined with the weakening of the risk-linked Aussie, Kiwi and Loonie, suggest that markets traded in a risk-off fashion yesterday and today in Asia.
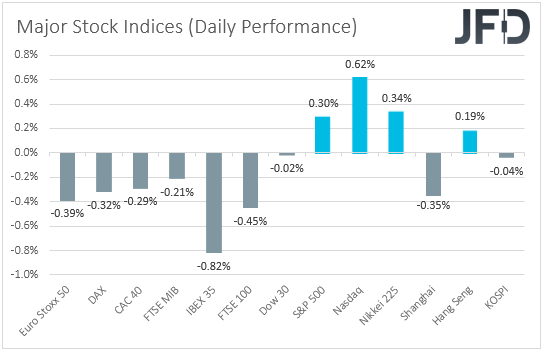
However, turning our gaze to the equity world, we see that this was the case only during the European session. Later in the US, the Dow Jones traded virtually unchanged, and both the S&P 500 and NASDAQ gained, with the improved appetite rolling somewhat into the Asian session today.
European stocks pulled back from a six-week high yesterday, perhaps with investors still feeling the heat of Evergrande's decision to abandon plans to sell a $2.6 billion stake in one of its key units.
SAP (NYSE:SAP) reported better than expected earnings. In a separate call with analysts, its Chief Financial Officer Luka Mucic said that the group's forecasts for 2022 profits were flat or slightly lower. This may have dented sentiment in Europe.
Having said all that, though, market participants appeared willing to buy again during the US session, despite IBM (NYSE:IBM) missing its market estimates for quarterly revenue.
Perhaps they maintained confidence in the US economy due to data showing that initial jobless claims hit a 19-month low last week and existing home sales surged to an 8-month high in September.
Speaking about economic data, today, the spotlight is likely to fall to the preliminary PMIs for October from the Eurozone, the UK, and the US. This will be the first sign of how major economies have been performing during this month.
In the Euro area, both the manufacturing and services indices could decline somewhat, taking the composite index down to 54.3 from 56.2. This could confirm that the latest energy shortages have left their mark on the Euro-area economy and may weigh somewhat on the euro.
However, due to investors already being aware of the matter, a slight decline may not come as a surprise, and thus, we don't expect a significant impact. After all, a composite index above 50 still points to expansion.
We believe that a miss of estimates could trigger some panic-selling. For now, we prefer to exploit some further euro-weakness against currencies like the Kiwi and pound. This is because the Reserve Bank of New Zealand (RBNZ) and Bank of England (BoE) central banks have started raising interest rates, or they could do so fairly soon.
As for the UK prints, no forecasts are available, while in the US, expectations are for only fractional changes. If it materializes, we don't expect it to have a significant impact on the greenback, as they may barely alter expectations around the Fed's course of action.
As of now, market participants remain convinced that the Committee will begin its tapering process in November, while, according to the Fed funds futures, they expect a 25 bps hike in October 2022.
Euro Stoxx 50 – Technical Outlook
The Euro Stoxx 50 cash index traded lower yesterday but hit support at 4137. Today, it edged slightly higher. Overall, the index remains above the last downside resistance line taken from the high of Sept. 16 and above the short-term upside one drawn from the low of Oct. 6.
In our view, these technical indicators keep the short-term outlook positive. We believe that today's recovery may continue for a while more, perhaps towards the peak of Oct. 15, at 4188, or the high of Sept. 23, at 4205.
If the bulls charge higher, we could see them targeting the 4250 area, which stopped the index from drifting higher on Sept. 1 and 6. Another break above 4250 would take Euro Stoxx into territories last seen in early 2008, with the next potential resistance zone being around 4300.
On the downside, we would like to see a dip back below 4100, support marked by the inside swing high of Oct. 8, before assuming that the bears are back in total control.
The price will already be below both the aforementioned diagonal lines. A dip below 4100 may encourage declines towards 4040, marked by the low of Oct. 13, or towards 4017, marked by the low of the day before. Another break, below 4017, could lead to declines towards the low of Oct. 6, at 3963.

EUR/GBP – Technical Outlook
EUR/GBP traded in a consolidative manner yesterday and today in Asia, staying slightly above the critical support zone of 0.8420, which has prevented the pair from dropping further since last Friday.
Overall, the price structure suggests a downtrend that's been in place since Sept. 29, but to get confident on its continuation, we would like to see a break below 0.8420 first.
Such a dip will confirm a forthcoming lower low and may initially target 0.8385, marked as a support by the low of Jan. 24, 2020. If that barrier cannot halt the slide, its break may carry larger bearish implications, perhaps paving the way towards 0.8335, marked by the low of Feb. 25.
To start examining the bullish case, we would like to see a recovery back above 0.8472, a barrier that provided strong support between Oct. 7 and 13. This would confirm a forthcoming higher high on the 4-hour chart, paving the way towards the 0.8503 and 0.8526 levels.
If the bulls are unwilling to stop at neither zone, the extensions towards 0.8545 and then towards 0.8573 could be possible. Those two latter levels are marked by the highs of Oct. 5 and 4, respectively.
As for the Rest of Today's Events
During the Asian session, we got Japan's national CPIs for September, while during the early European morning, the UK retail sales for the month were out. Both Japan's headline and core rates rebounded within the positive territory.
Still, they remain well below the Bank of Japan's (BoJ) objective of 2%. Policymakers are unlikely to be tempted to start thinking about monetary policy normalization anytime soon. In the UK, both headline and core sales slid by more than expected.
As for the speakers, we have two on today's agenda: Fed Chair Jerome Powell and San Francisco Fed President Mary Daly.