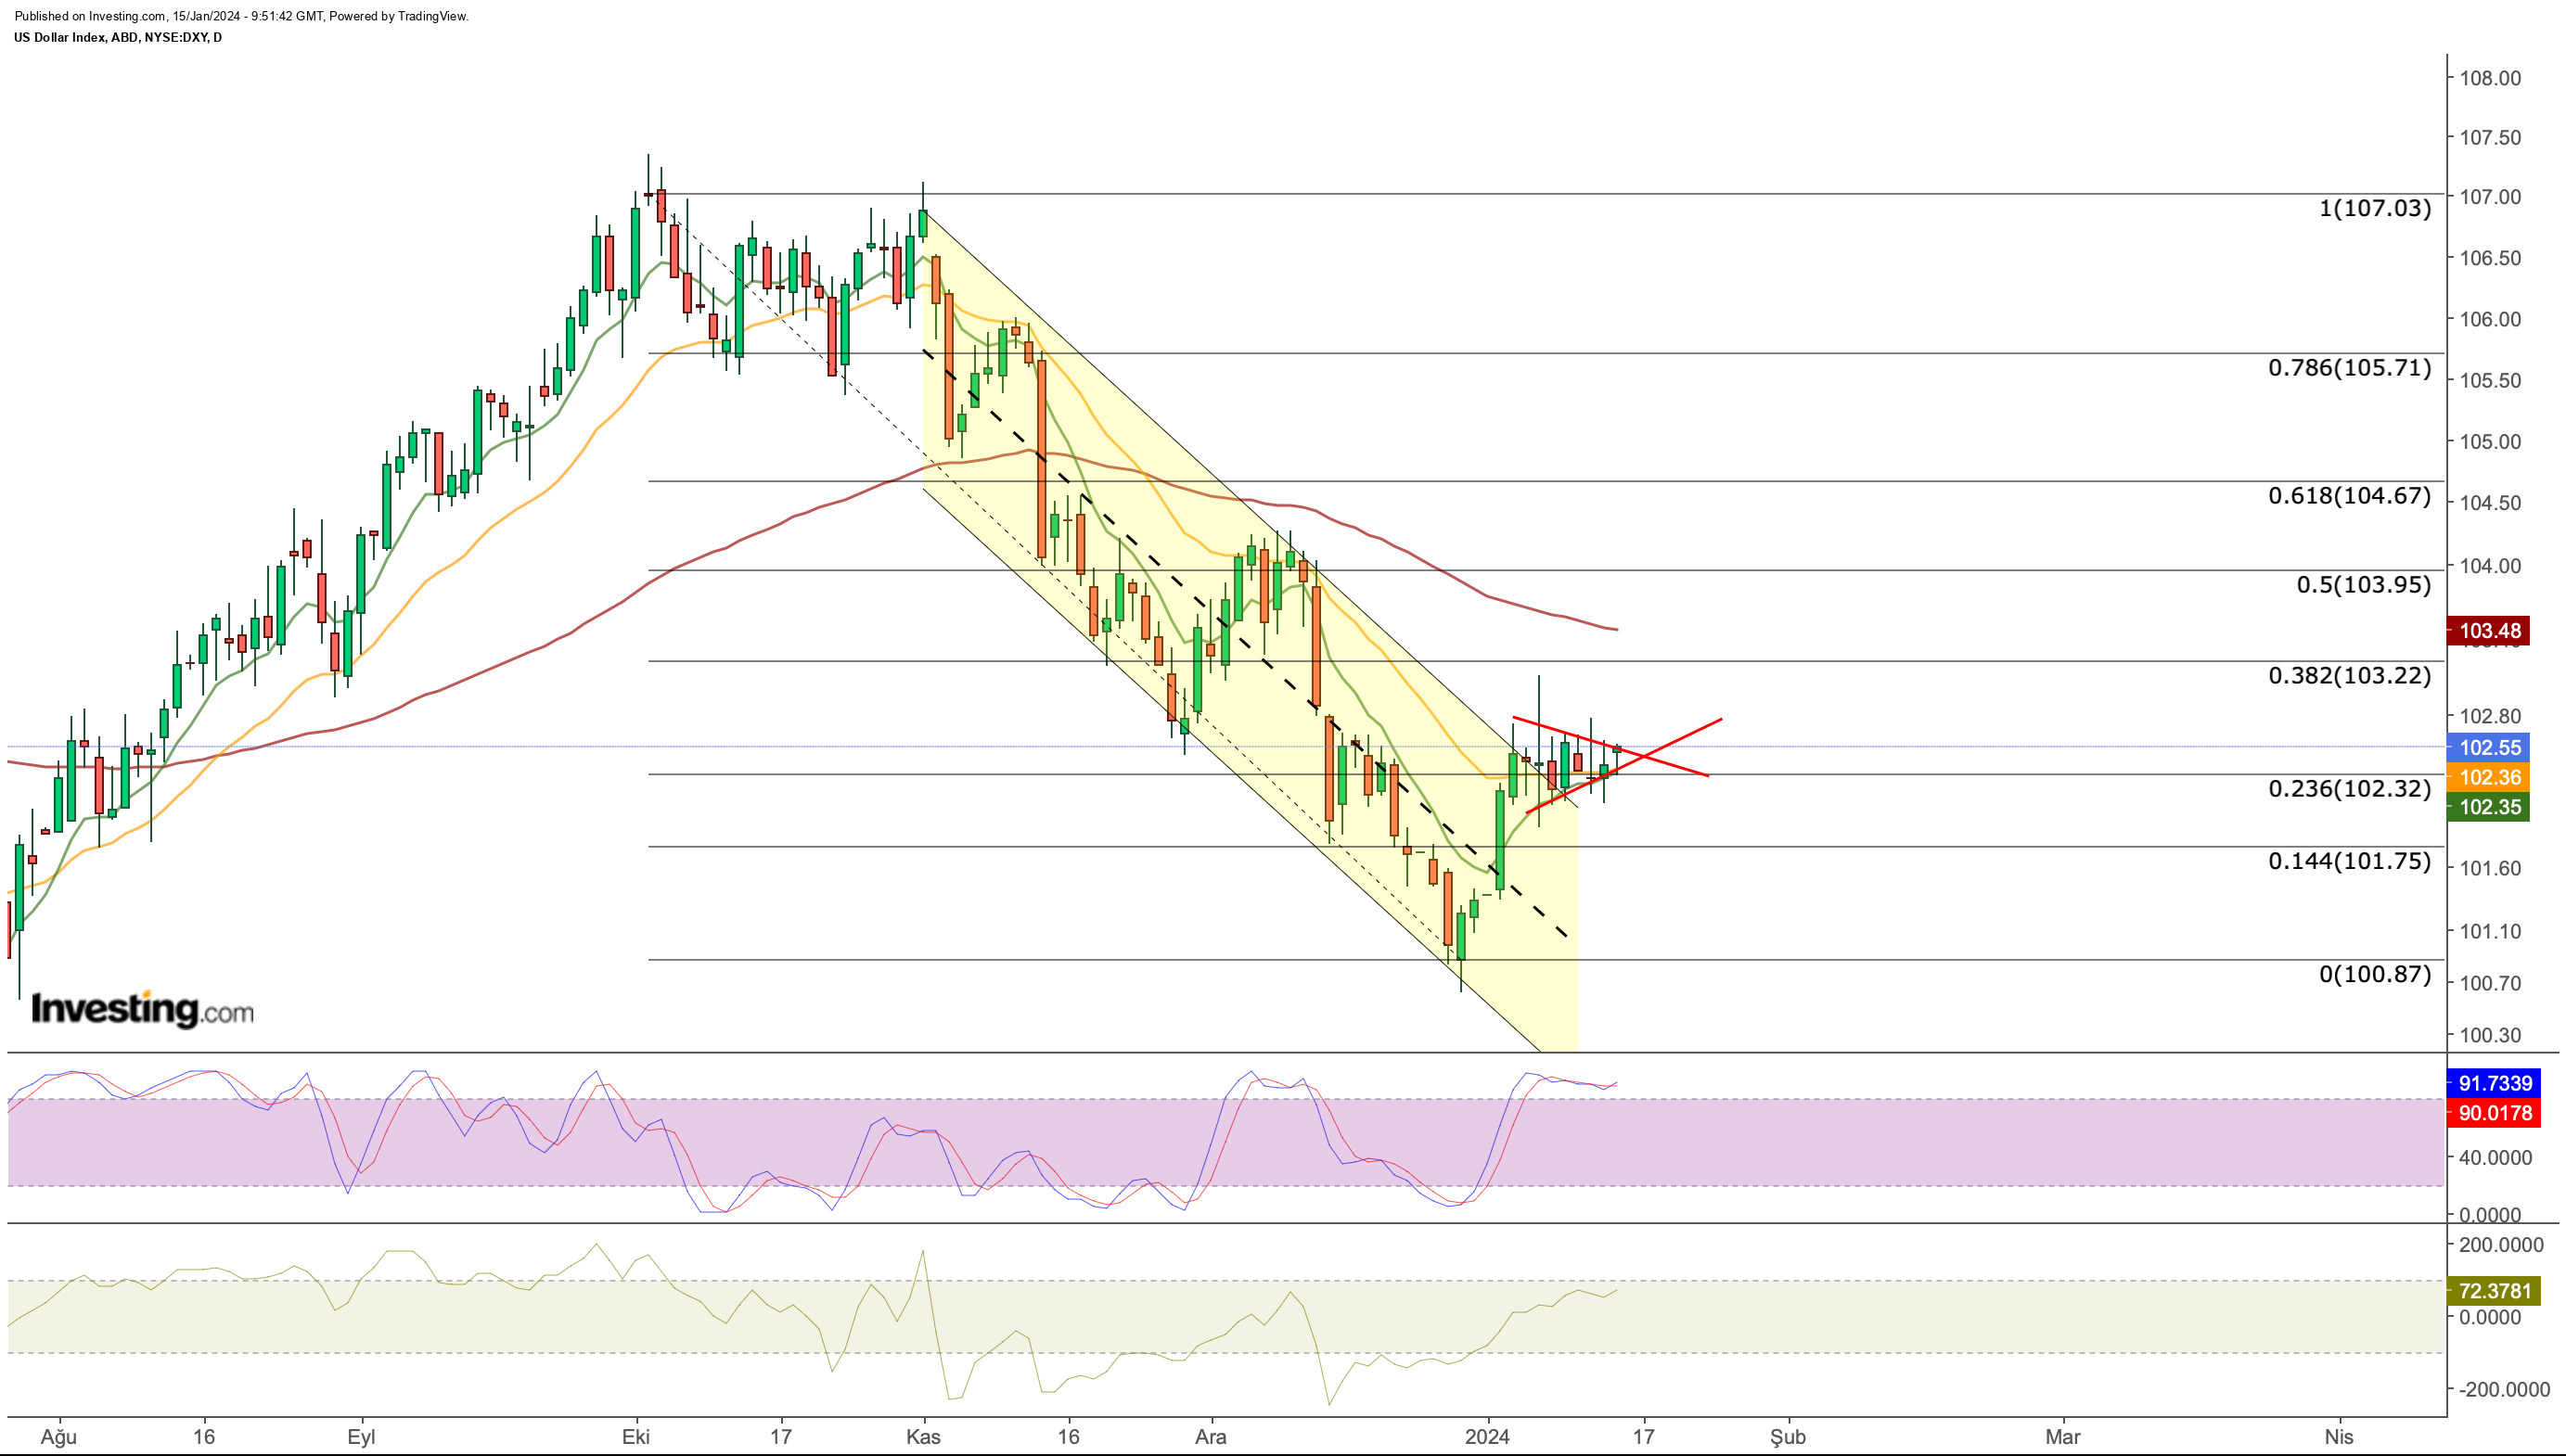
- Recent developments have led the US dollar index into a trading-range squeeze, causing it to hover between 102.3 and 102.6.
- In this piece, we will analyze potential scenarios based on the breach of closely positioned support and resistance levels, mixed economic data, and geopolitical tensions.
- Meanwhile, gold could continue to shine as rate cut bets linger and geopolitical tensions persist.
- Looking to beat the market in 2024? Let our AI-powered ProPicks do the leg work for you, and never miss another bull market again. Learn More »
Analyzing the US dollar index, the daily chart immediately reveals a squeeze following the weakening of the downward momentum.
Despite a strong start to the year, DXY found itself squeezed between 102.3 and 102.6, influenced by recent developments.
Should the short-term triangle formation be breached with daily closes above 102.6, the next hurdle at the 103.2 level becomes the focus.
Conversely, a break in the lower region may initiate a decline, dipping below 102.3 to 101.75 and potentially targeting the 100 regions.

Despite the above-expected inflation data last week, the decline in producer prices confused investors, and this was reflected as a squeeze on the DXY chart.
Consequently, the DXY, having broken its steep accelerated downtrend upwards, failed to sustain its trajectory following mixed data last week and instead entered a sideways movement.
This scenario heightens the likelihood of the dollar continuing its course based on the breach of closely positioned support and resistance levels.
Gold Maintains Upside Potential
The gold market continues to be driven by expectations of a Fed rate cut and the escalation of tensions in the Middle East.
Two developments on the agenda, one economic and the other geopolitical keep the demand for gold prices alive.
Despite the cautious rhetoric of regional Fed presidents, market investors continue to maintain their view that interest rate cuts may start in March.
This approach shows that the recent statements of Fed members have not yet changed the market's view. As a result, the market continues to keep the Fed under pressure to cut interest rates.
The expectation that the Fed will cut interest rates in March is still high with a probability close to 80%.
The Fed's meeting at the end of the month has become extremely important for the upcoming period. The absence of any negative economic data until the meeting will increase the likelihood of a favorable message from the meeting.
On the other hand, another phenomenon that supports the upward momentum in gold prices is the high level of tension in the Middle East.
The war between Israel and Hamas entered its 100th day and messages from the Israeli side continue to come from the Israeli side that the war will last for a long time.
In addition, the US and UK's attack on the Houthis and the Houthis' threat of retaliation have increased the possibility of the tension spreading to the Middle East.
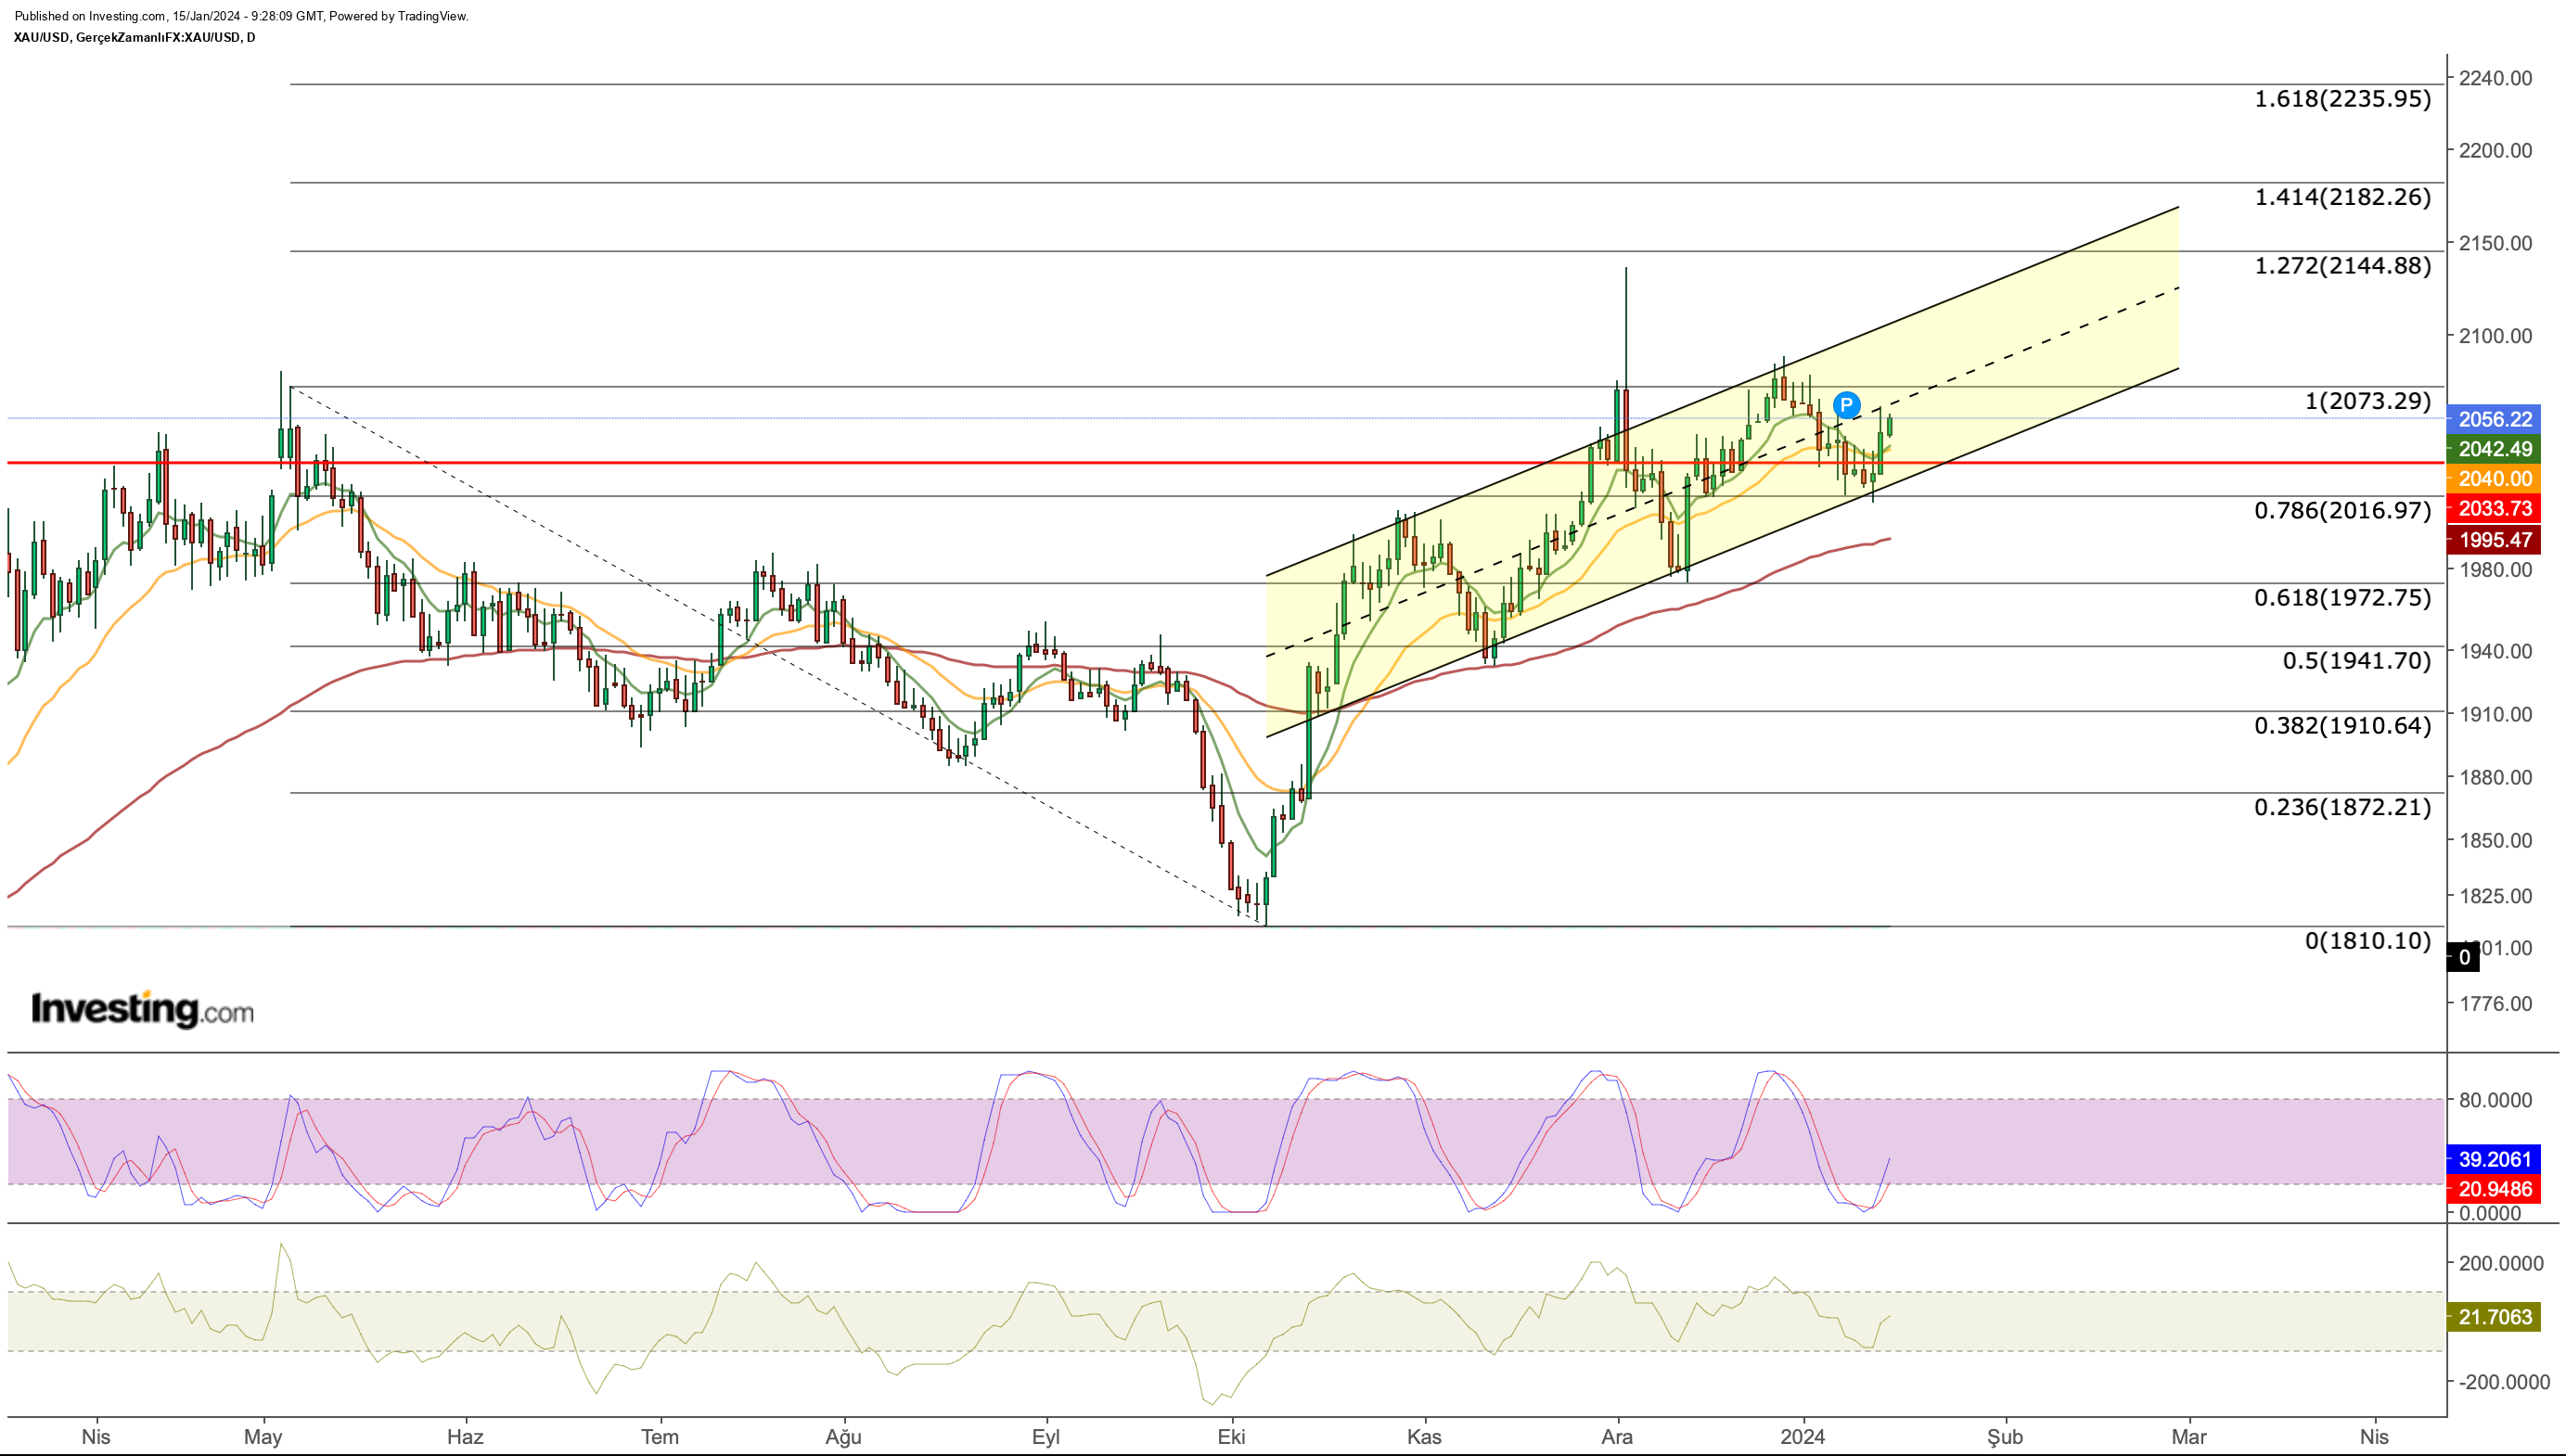
Gold, which continues to move in the rising channel due to these two developments, technically has some signals that support the upward movement. 
After forming a bear trap pattern in the first half of October, gold gained upward momentum. This momentum continues along a channel with higher highs and lower lows.
On this path, gold, which started 2024 with a decline, found support at an average level of $ 2,020 towards the lower band of the channel last week and then turned its direction up again.
Today, the $ 2,070 level, which corresponds to the middle band of the channel, will be followed as the first resistance price for gold.
If this region can be crossed with daily closes, we can see a rise up to Fib 1,272, the first stage of Fibonacci expansion levels according to the last downtrend.
This could lead to the next peak in the $2,140 region. The short-term exponential moving averages also have an impetus for a continuation of the uptrend underneath.
In addition, the Stochastic RSI's steep acceleration out of the oversold zone on the daily chart also reflects a bullish potential.
As a support point this week, the $2,030 level, which coincides with the lower band of the rising channel, can be followed. A downward momentum below this value is likely to invalidate the current bullish setup.
***
In 2024, let hard decisions become easy with our AI-powered stock-picking tool.
Have you ever found yourself faced with the question: which stock should I buy next?
Luckily, this feeling is long gone for ProPicks users. Using state-of-the-art AI technology, ProPicks provides six market-beating stock-picking strategies, including the flagship "Tech Titans," which outperformed the market by 670% over the last decade.
Disclaimer: This article is written for informational purposes only; it does not constitute a solicitation, offer, advice, or recommendation to invest as such it is not intended to incentivize the purchase of assets in any way. I would like to remind you that any type of asset, is evaluated from multiple perspectives and is highly risky and therefore, any investment decision and the associated risk remains with the investor.

