
The uneasy truce, for lack of a better word, between Trump and Xi at the G20 summit to avoid a potential full-blown trade war, has led to the extension of the ‘risk on’ tone with the likes of the commodity currencies, as the indices performance chart illustrates, the most benefited. The interbank adjustments in forex quotes (gaps) ahead of the retail open in Asia, do feel overstretched on the preconditions of an event largely priced in since last week, with the addition that the temporary truce, at this stage, is simply an agreement of intentions. Nothing has been achieved yet on all the sensitive issues that remain on the table even if one can argue that the avoidance of further tariffs and rolling back some restrictions on Huawei are acting as a driver. So, one must question how much fuel is left until we see a meaningful reversal? Are we in a buy the rumor sell the fact? For now, there is no reason to be too defensive if looking to exploit momentum trades intraday the likes of AUD/JPY or AUD/CHF as the trend should be your friend. It is, however, when one steps back to take a bigger view off the daily, where the overcooked nature of certain currency movements start to become more obvious, which leads me to think there are no clear cut daily signals of note. That said, I do find fading strength in the USD/JPY to offer solid merit while awaiting the market to show its hand post the G20 in the conglomerate of currency crosses. While the G20 meeting outcome is positive for the AUD/USD, the RBA must decide tomorrow if it cuts the cash rate further, and with trade strifes not really part of the RBA’s justification on its current easing cycle, there is understandably cautioun that the RBA will go for another rate cut following the June one. Pricing for a cut to 1% stands around 65%, only marginally lower than the 70% on Friday. Even if an eventual comprehensive trade deal remains elusive and a far-fetched outcome given the major discrepancies still standing in the way of both superpowers, one consideration to let it sink in too is the fact that the Fed cut expectations are likely to see a sustained trimming in the immediate future (July 31st) while the dovish prospects over the next year should barely budge. This Friday's June payrolls (Jul 5), alongside other key releases this month such as CPI (Jul 11), retail sales (Jul 16) and Q2 GDP (Jul 26) will also be key.
Narratives In Financial Markets
* The Information is gathered after scanning top publications including the FT, WSJ, Reuters, Bloomberg, ForexLive, Institutional Bank Research reports.
- Following the high-stakes meeting between President Trump and China’s Xi, a temporary truce to avoid the escalation of the trade war is the best outcome one could have hoped for, as both sides find a compromise to resume talks in the months ahead.
- The time horizon has stretched to the extent that few expect the two major global economies to find a meaningful compromise to put off the fire till year-end at minimum. As Trump tweeted, which confirms this premise unless the tactics change, “the quality of the transaction is far more important to me than speed."
- The key details that emerged out of the meeting in the G20 include the confirmation that the US will not levy new tariffs on Chinese goods, while softening the punitive rhetoric against Huawei, as Trump will now allow, on a strictly restrictive basis, for the Chinese tech giant to purchase equipment from US companies.
- In Trump’s words, this "complicated" Huawei issue will go to the backburner until the end of talks. White House economic advisor Kudlow added that Trump wasn’t planning a “general amnesty” on Huawei and that export controls would remain in place.
- Make no mistake, the truce reached by Xi and Trump, is just the avoidance of further escalation, but ahead lies the tougher tasks. Both sides will have a hard time trying to convince their parties to give much ground. Xi and party leaders have grown their skepticism about Trump’s agenda to undermine China’s economic model, while Trump cannot act or sound as it will cost him popularity and votes on the run-up to the 2020 election.
- For now, it’s all well-premeditated posturing/pretending with no meat on the bone. Consequently, the mild positive to bid risk is that the worst possible scenario won’t materialize, even if the hiking of tariffs remains, which may clearly undermine firms’ investment and hiring intentions.
- No reason to be exuberant about the Chinese economy, which without a doubt, has helped to tilt President Xi towards further attempts to steering back the ‘trade war’ boat adrift. In case one wonders if fundamentals are picking up, the weekend data lagged once again. China PMIs for June came at uninspiring levels, with the manufacturing at 49.4 vs 49.5 expected, while the series of the services stood at 54.2 vs 54.2 expected. Next up is the private survey PMIs via Caixin/Markit.
- As the South China Morning Post headlines: “Despite Donald Trump and Xi Jinping’s G20 handshake, mistrust and disputes persist”, which is what leads me to believe that the soft patch in Chinese manufacturing conditions we are seeing may persist for quite some time.
- The official G20 communique in Osaka warned that global growth remains precariously subdued and risks were tilted to the downside, with trade and geopolitical tensions on the rise. “We strive to realize a free, fair, nondiscriminatory, transparent, predictable and stable trade and investment environment, and to keep our markets open.”
- Russia and Saudi Arabia have come to agree on an extension on the OPEC+ oil output curbs for 6 to 9 months. "We will support the extension, both Russia and Saudi Arabia. As far as the length of the extension is concerned, we have yet to decide whether it will be six or nine months. Maybe it will be nine months," Saudi Energy Minister Khalid al-Falih” said.
- Deputy Governor of the RBNZ Geoff Bascand gave a speech on macroprudential tools this Monday in Asia, noting that scope exists for further easing in LVRs (loan-to-value ratios) if risks decline. Bascand added that “our refreshed strategy on macroprudential policy provides us with greater clarity on how we will use macroprudential tools in the future.”
- Last Friday’s US May PCE core came a tad higher at +1.6% y/y vs 1.5% expected. As long as the reading is below 2%, which has been the case for most of the last 7 years, the Fed can find no justification to sound more hawkish on the basis of inflationary risks. Similarly, it won’t hurt the case for rate cuts since no deterioration in its favored inflation measure existed.
- The Canadian data continues to earn my respect as both the April GDP, at +0.3% vs +0.2% expected, and the Canadian Business Outlook Survey topped expectations. The oil and gas sector contributed the most to the blip higher seen. Meanwhile, the encouraging numbers out of businesses forward-looking economic expectations are yet another source to be optimistic about the prospects of a no cut by the BoC. Judging by the CA bond yield spreads, the recent offered tone in the bonds (higher yields) reflects positivism in this front.
- The US Chicago PMI took a major hit by falling under 50.00, which is the level that defines, in economics 101, expansions from contraction. The reading of 49.7 vs 53.5 expected. If there was any doubt that protectionism and the ramifications of the trade war are feeding through businesses’ outlook, over 80% of the Chicago PMI firms surveyed replied they were negatively impacted due to tariffs raising prices of their goods leading to a pullback in orders.
- Australia’s Housing indicators, based on the metrics via the weekend auction clearance rates, keep recovering, with levels of stabilization above 60%. Even if volumes are still significantly lower than last year, the prelim clearance rate has seen a marked improvement since last year.
Recent Economic Indicators & Events Ahead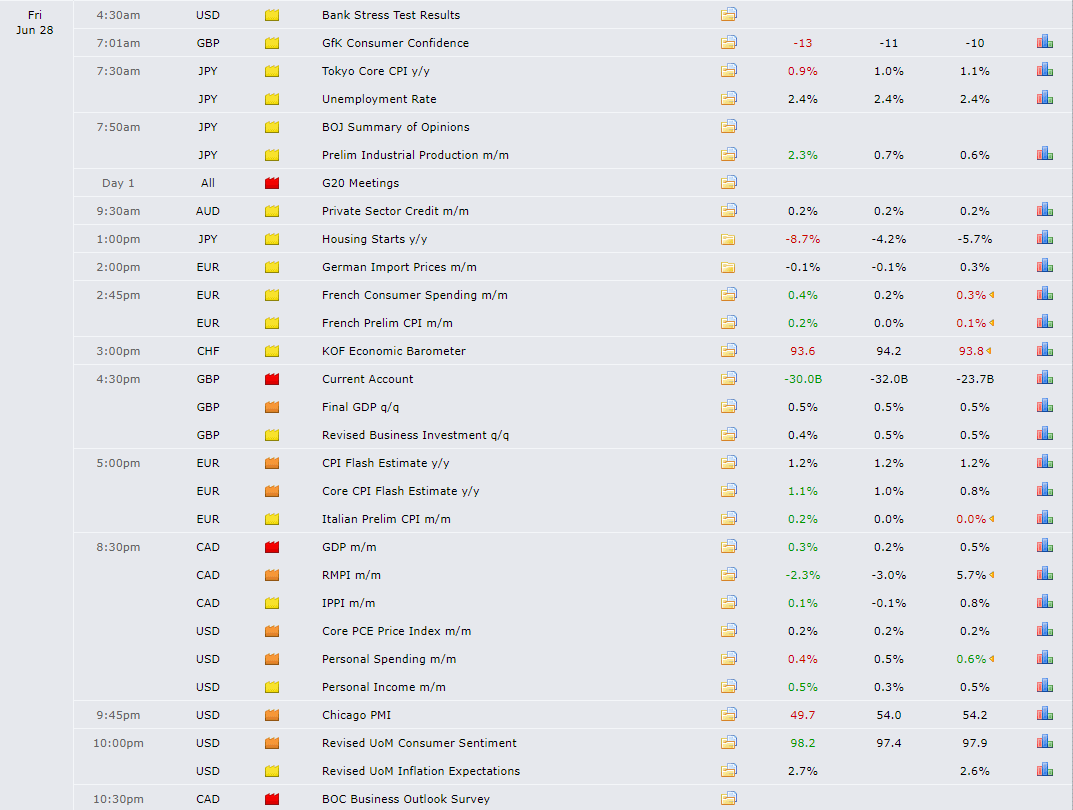
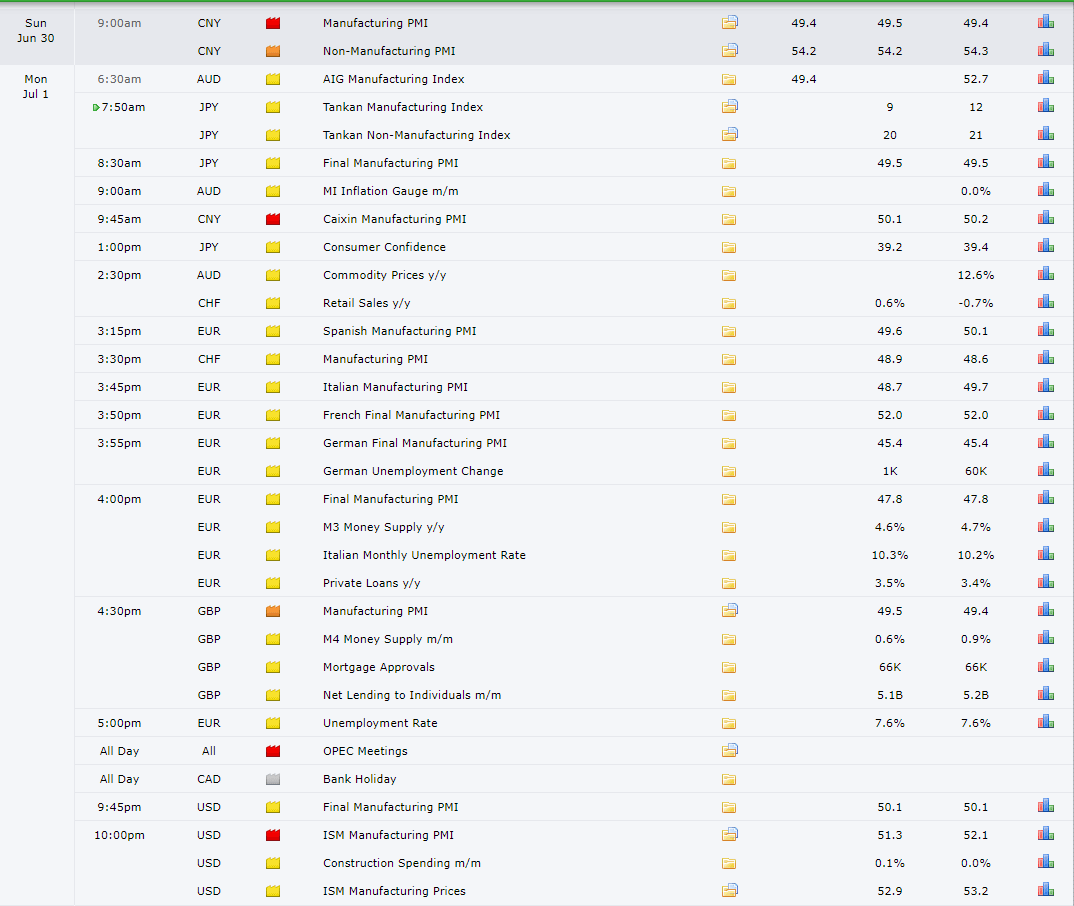
Source: Forexfactory
RORO (Risk On, Risk Off Conditions)
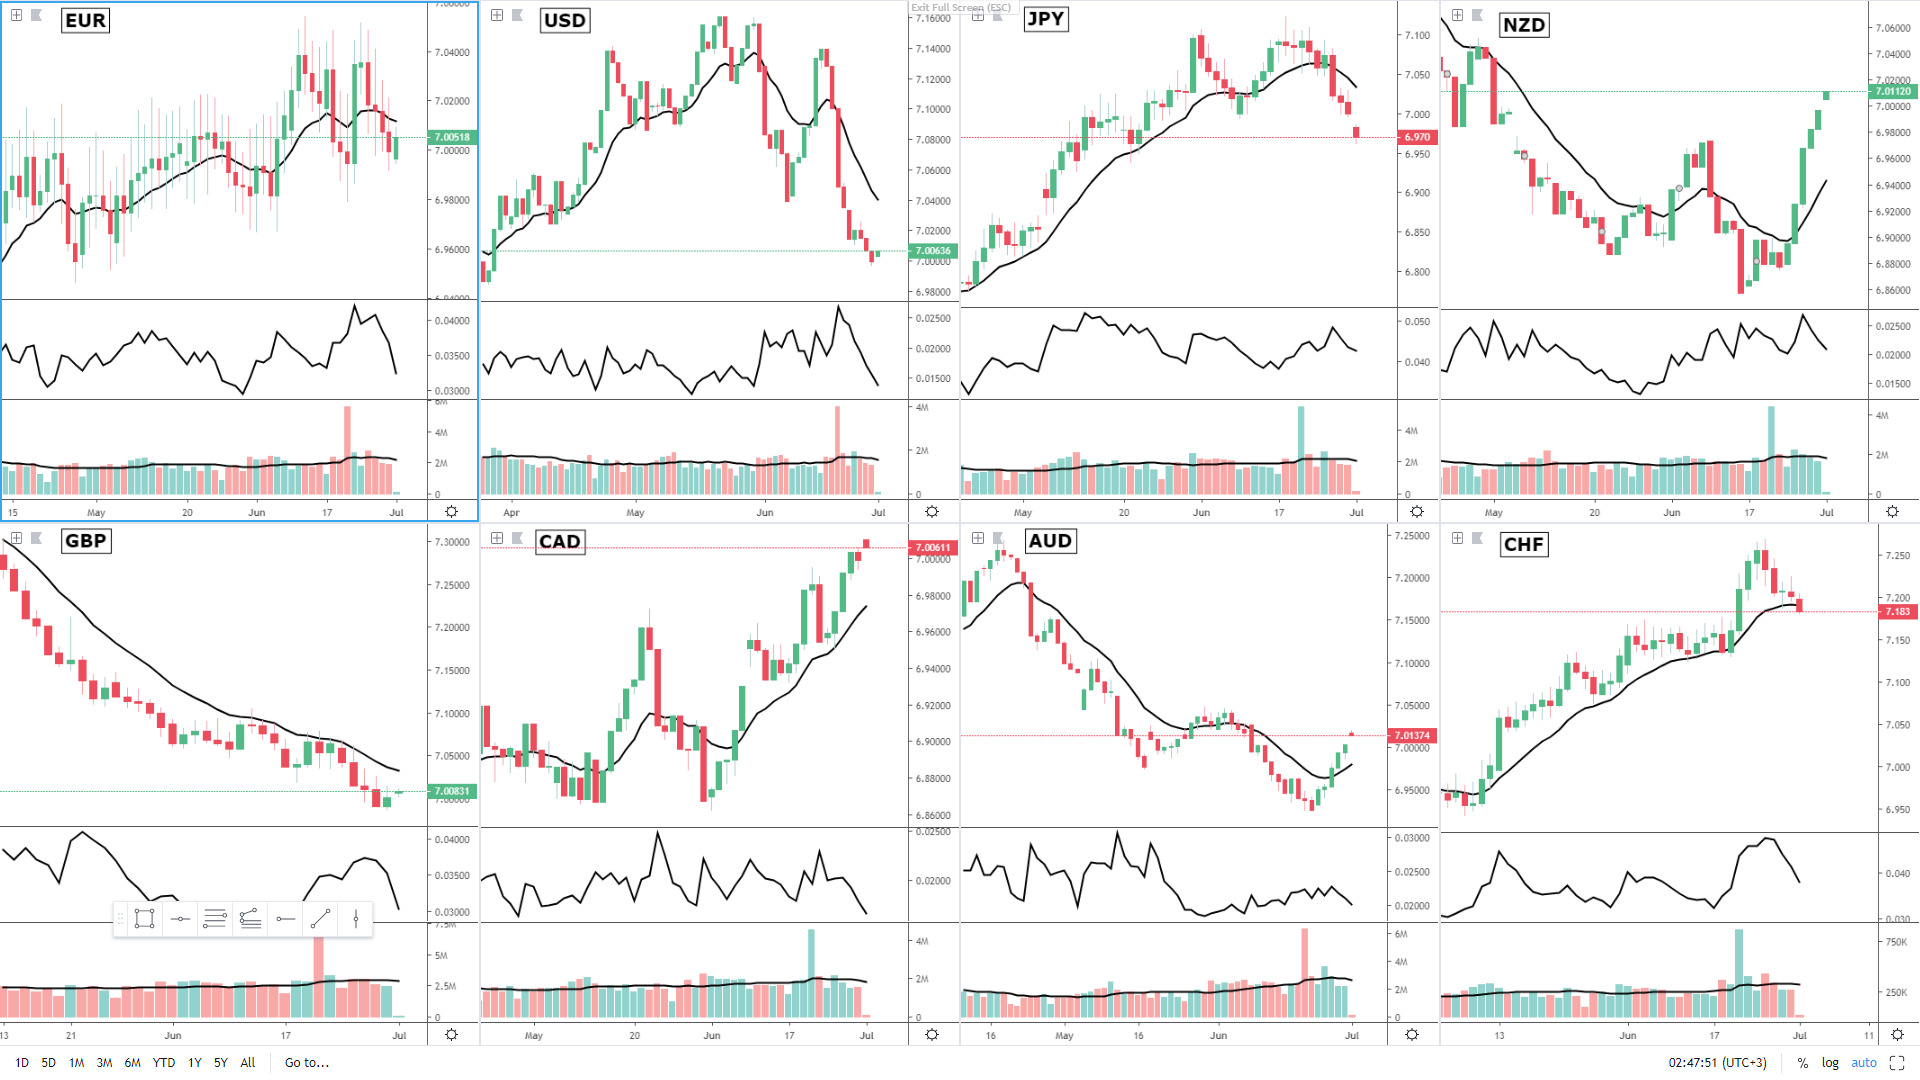
Risk assets have opened in Asia with a bid tone as the US and China avert the worst case scenario by agreeing to resume trade talks. Now, I’d argue that as the bearish breakout in the JPY index below the daily baseline (13-EMA) or the performance in the Shanghai Composite (bullish), USD/CNH (bearish) can technically attest, the ‘truce’ trade has been, at least partially, if not fully, running its course by being priced in since last week. The gaps undeniably communicate the mood to bid risk is positive, while the lack of any details beyond the vague promises of both parties coming back to the drawing table, in what’s a ‘risk on’ move that had its initiation last week, do make a case for the gaps to be potentially filled before finding out whether or not ‘risk on’ buyers will continue to dominate the ebbs and flows. I wouldn’t be fighting the trend, which means overcommitting capital against the likes of the Aussie, Kiwi or the Loonie in this environment remains a dangerous proposition as the momentum on the China-US news has the pedigree to potentially last for days if not weeks, if history on how Trump can manipulate markets is any indication. The Japanese yen or the Swiss franc are two clear candidates to attract increasing selling interest amid this improving background.

A Dive Into FX (Technicals, Fundamentals, Intermarket)
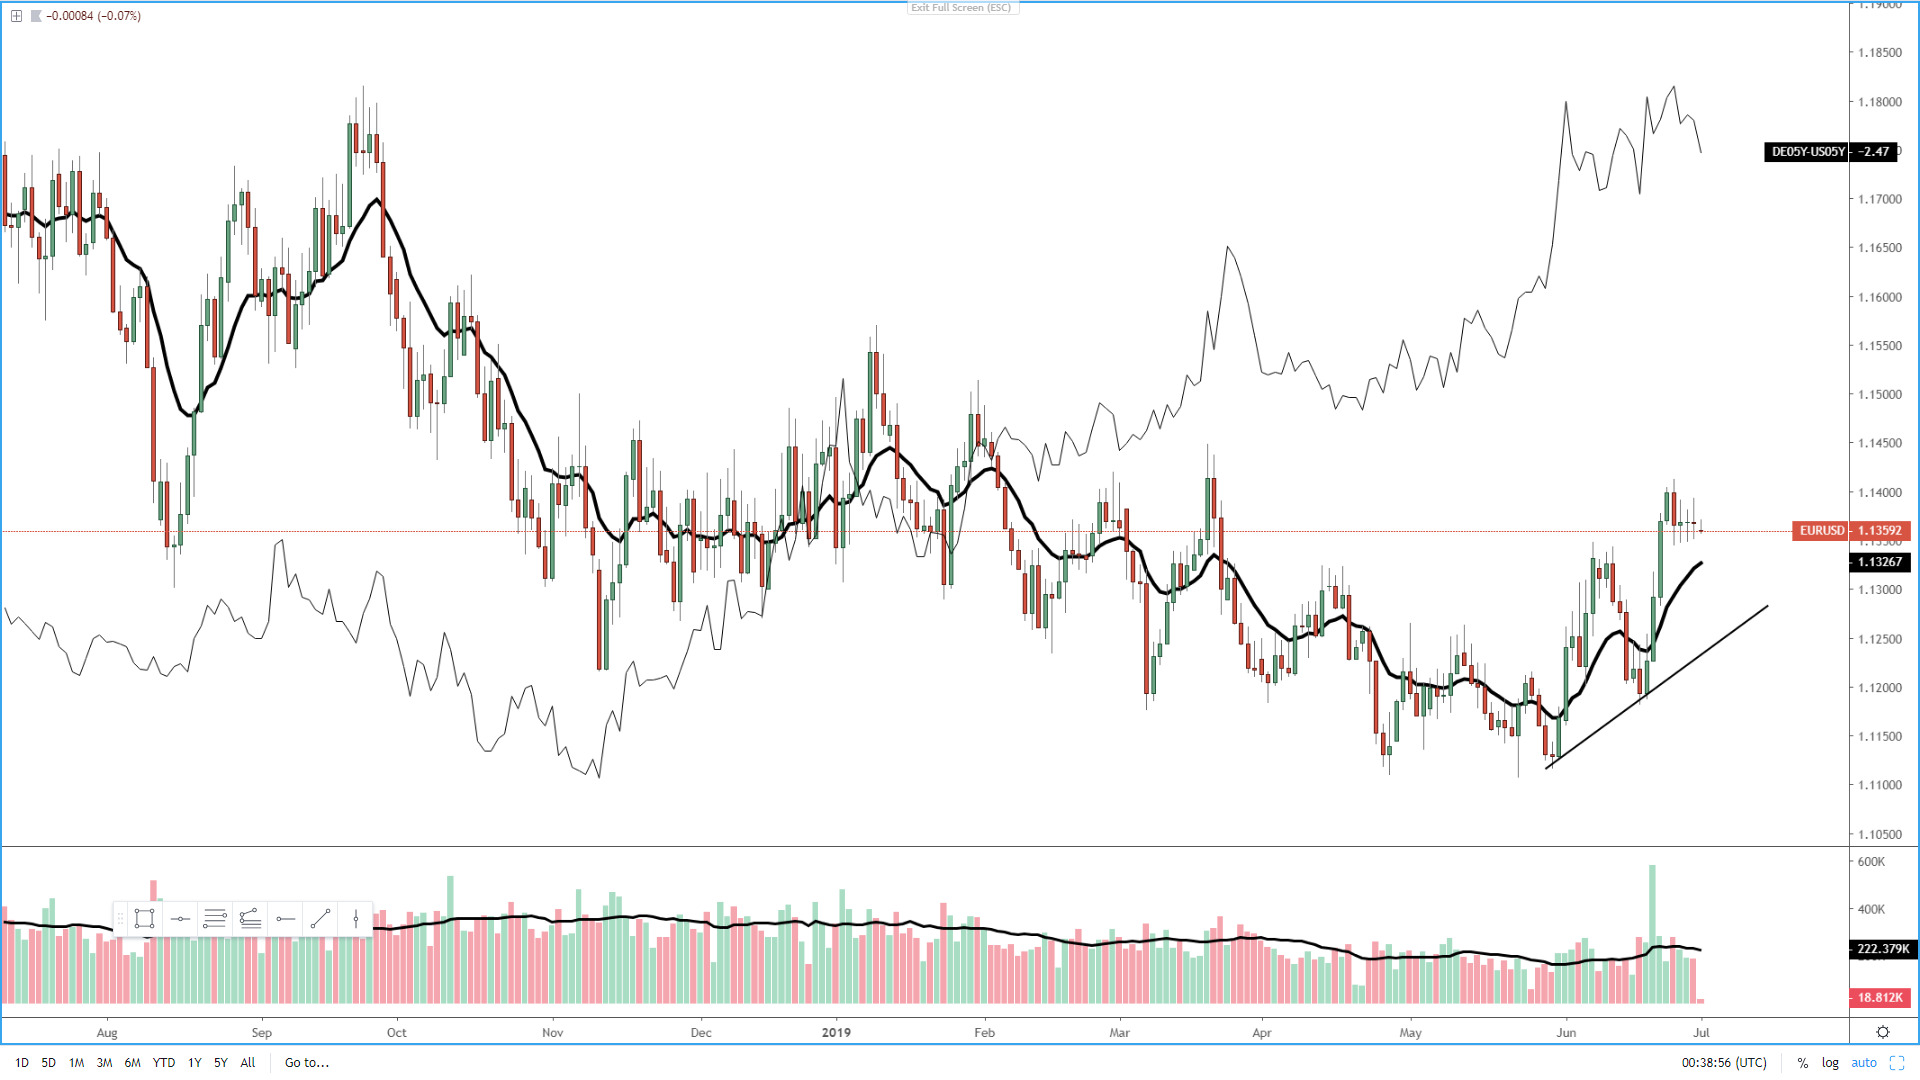
For those calling a positive path in the EUR/USD going forward, I can definitely see the merit behind defending such view even if the price looks awfully restrictive to engage from a risk-reward perspective when analyzing the daily chart. Why am I saying that? Because we are trading significantly above the 13-EMA baseline, which after tonnes of testing, is the newly adopted delimitation that I am using to determine if we are in an uptrend or in a downtrend on the daily chart. Other popular measures include the 5-EMA for shorter-term trend identification or the 21-EMA to adopt a longer horizon view. So, the current status in the EUR/USD is acceptance above 1.1350 in what’s become the narrowest trading range since 2004! That’s quite an eye-catching stat, but not the only one must take note, as the pair has achieved a successful bullish rotation with equilibrium found above its prior swing high. This is a very constructive technical occurrence that had not transpired in the daily chart since Sept of last year. What this bullish structure makes me anticipate is that bulls are definitely the force to be in control in July until proven wrong, which would include as an initial precursor a retake sub the 13-EMA with volume increasing, but even more important, sellers to be staring at the ascending trendline from the rear mirror.
If one is looking for some inspiration in the GBP/USD, I am afraid you won’t find any conclusive technical clues that may tilt the balance in either way out of the daily chart. Yes, the price is mildly above the 13-EMA baseline, but Friday’s bullish candle came on a rather poor volume below the average, not to mention that the area of liquidity around the 1.2750 as marked in red rectangle continues to prove a major nut to crack. That said, by checking the intermarket analysis, and unless any Brexit headlines distort this view, there continues to exist value to be a buyer on weakness.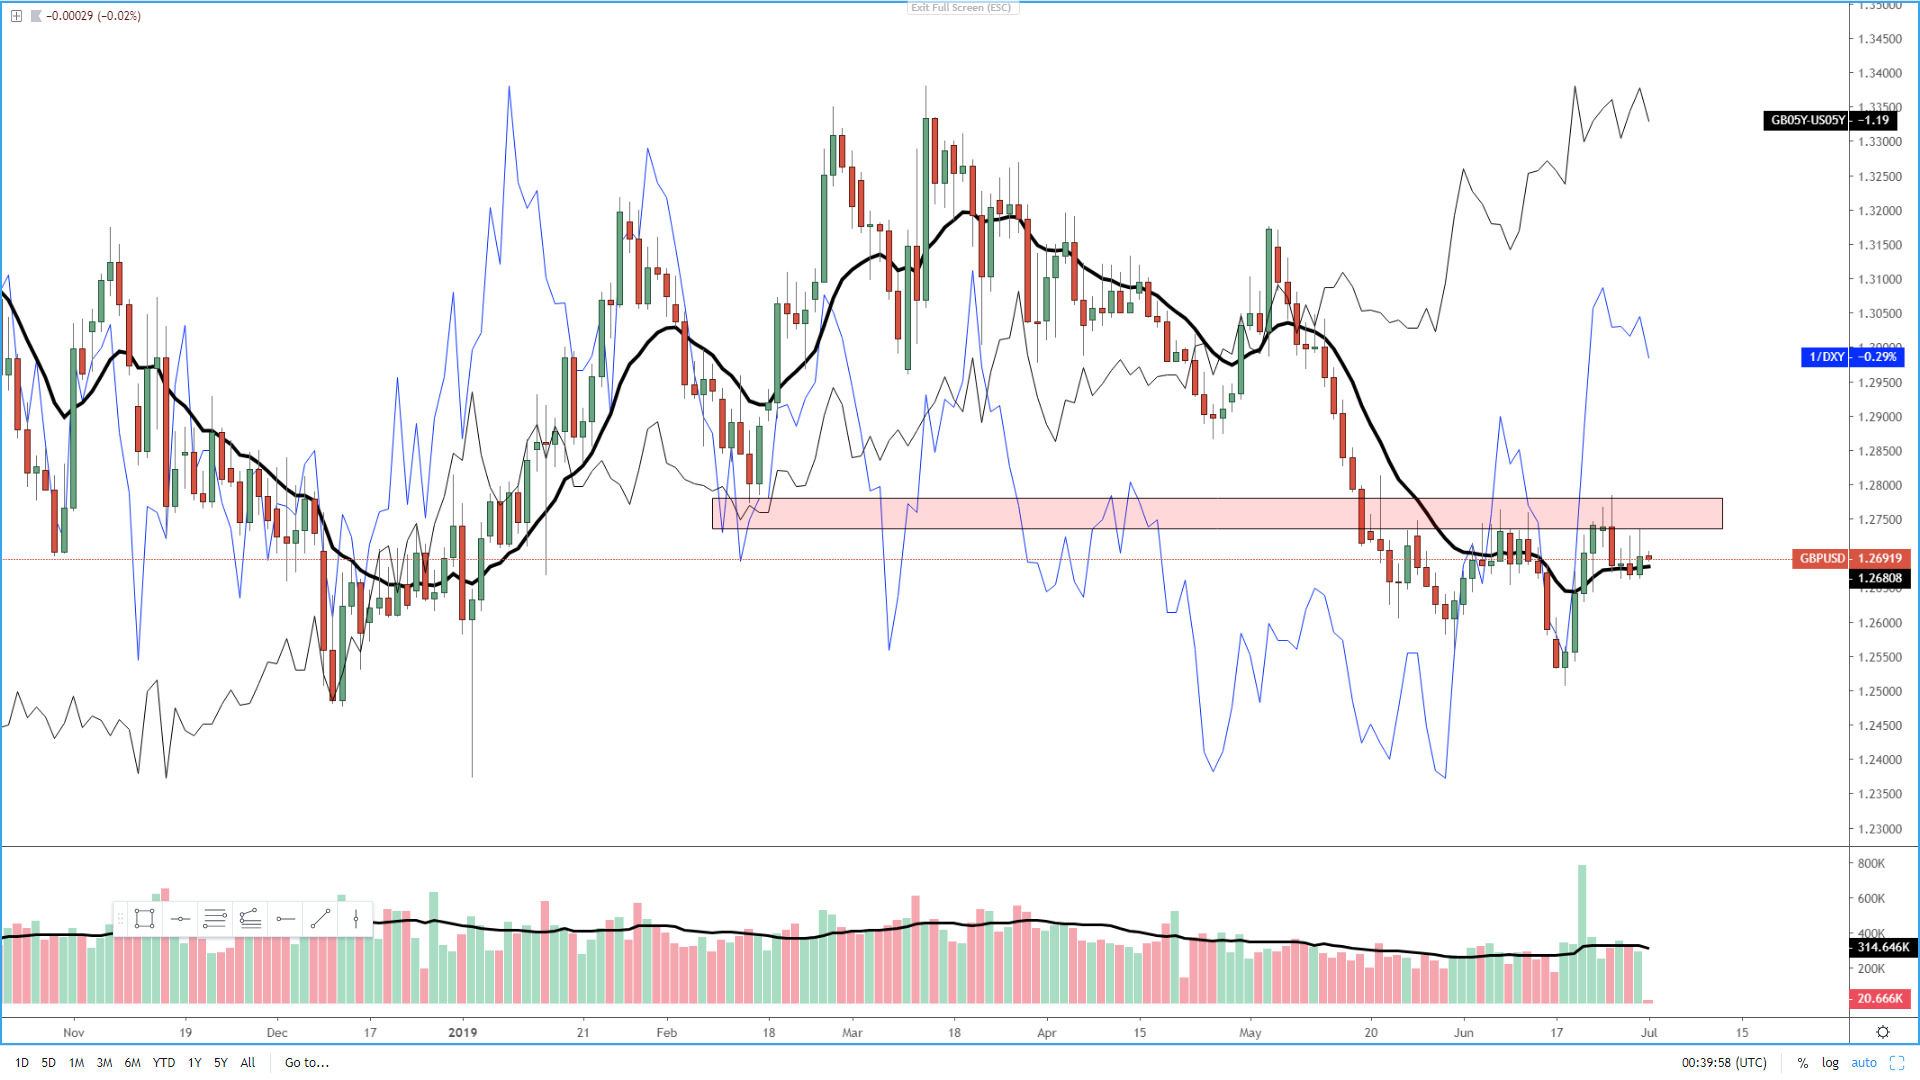
Moving into the USD/JPY, just as the US-China trade truce appears rather vague in nature at this point, so does the attempts by this pair to break a key liquidity area at 108.50. One, which I will remind the readership, originates after a successful rotation lower, in other words, there is technical value to engage in shorts, especially on a gap higher amid the clear risk of an overcooked move as the US-China trade truce had been factored in since last week. Sell the fact, anyone? What’s more, by anchoring the DXY and US30Y bond yields (main drivers of USD/JPY), both assets trade significantly lower at a time when the pair is testing prior resistance. This means the higher it goes to retest the 108.50 vicinity and above, the greater the discount in price it offers.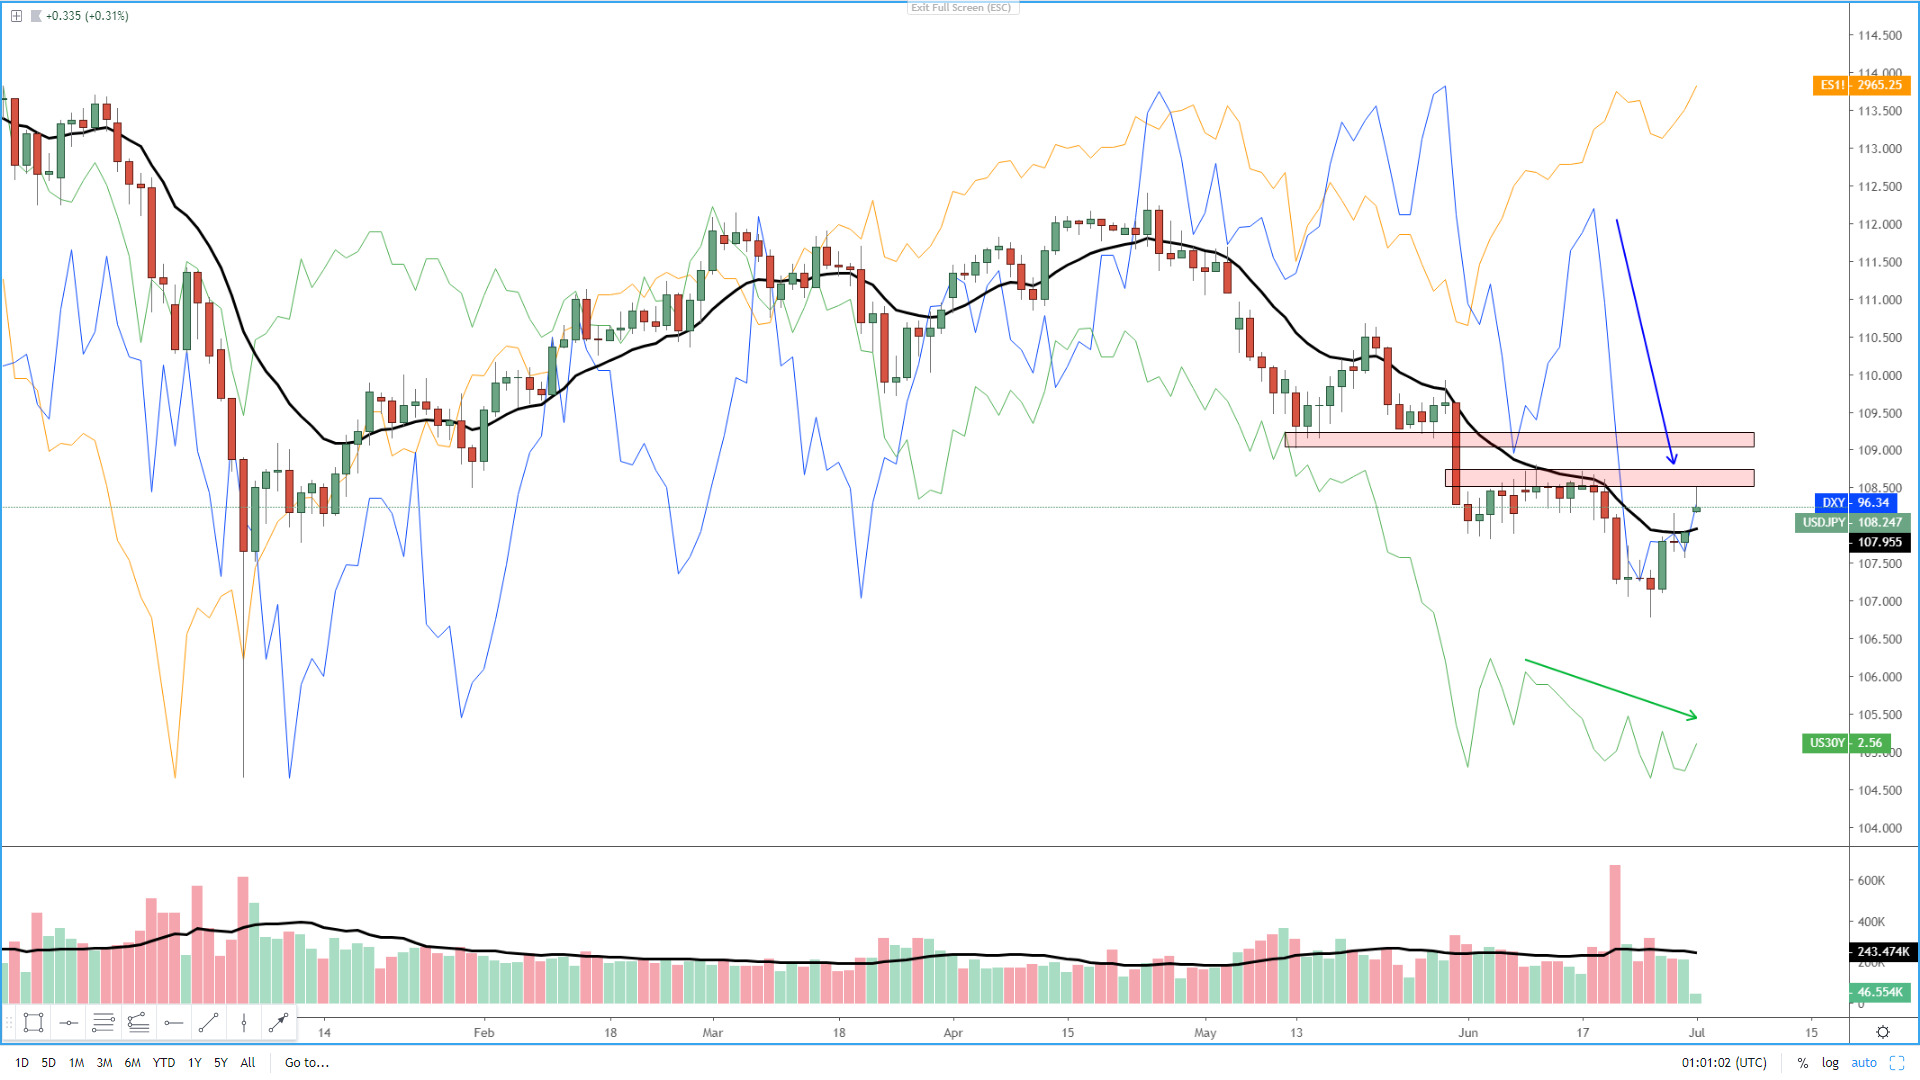
What can we learn from the AUD/USD daily chart today? Firstly, the current bullish momentum is the most meritorious seen, based on the impulsivity of the leg, since late January this year. In favor of bullish continuation flows not only we find the fundamental support of the US-China soft breakthrough, but the close of Friday’s candle above the prior swing high is a testament that sellers are not as prolific in their conviction as they used to. If we throw into the mix, the positive flows in equities, the Chinese yuan and the Aus-US bond yield spread, one can clearly make the case why I am of the opinion that looking for reversal shorts are not a trade that the technical status would suggest. On the flip side, I see two potential negatives. Firstly, the distance to the 13-EMA baseline does warrant caution as price tends to struggle to extend much further until a correction back to the mean. Secondly, as the move creeps higher, the volume is stagnant below its average, which is what eventually leads to a movement exhausting and reversing. Overall, this is still a market to play long but at the right levels, which would have been about a week ago not at the current price.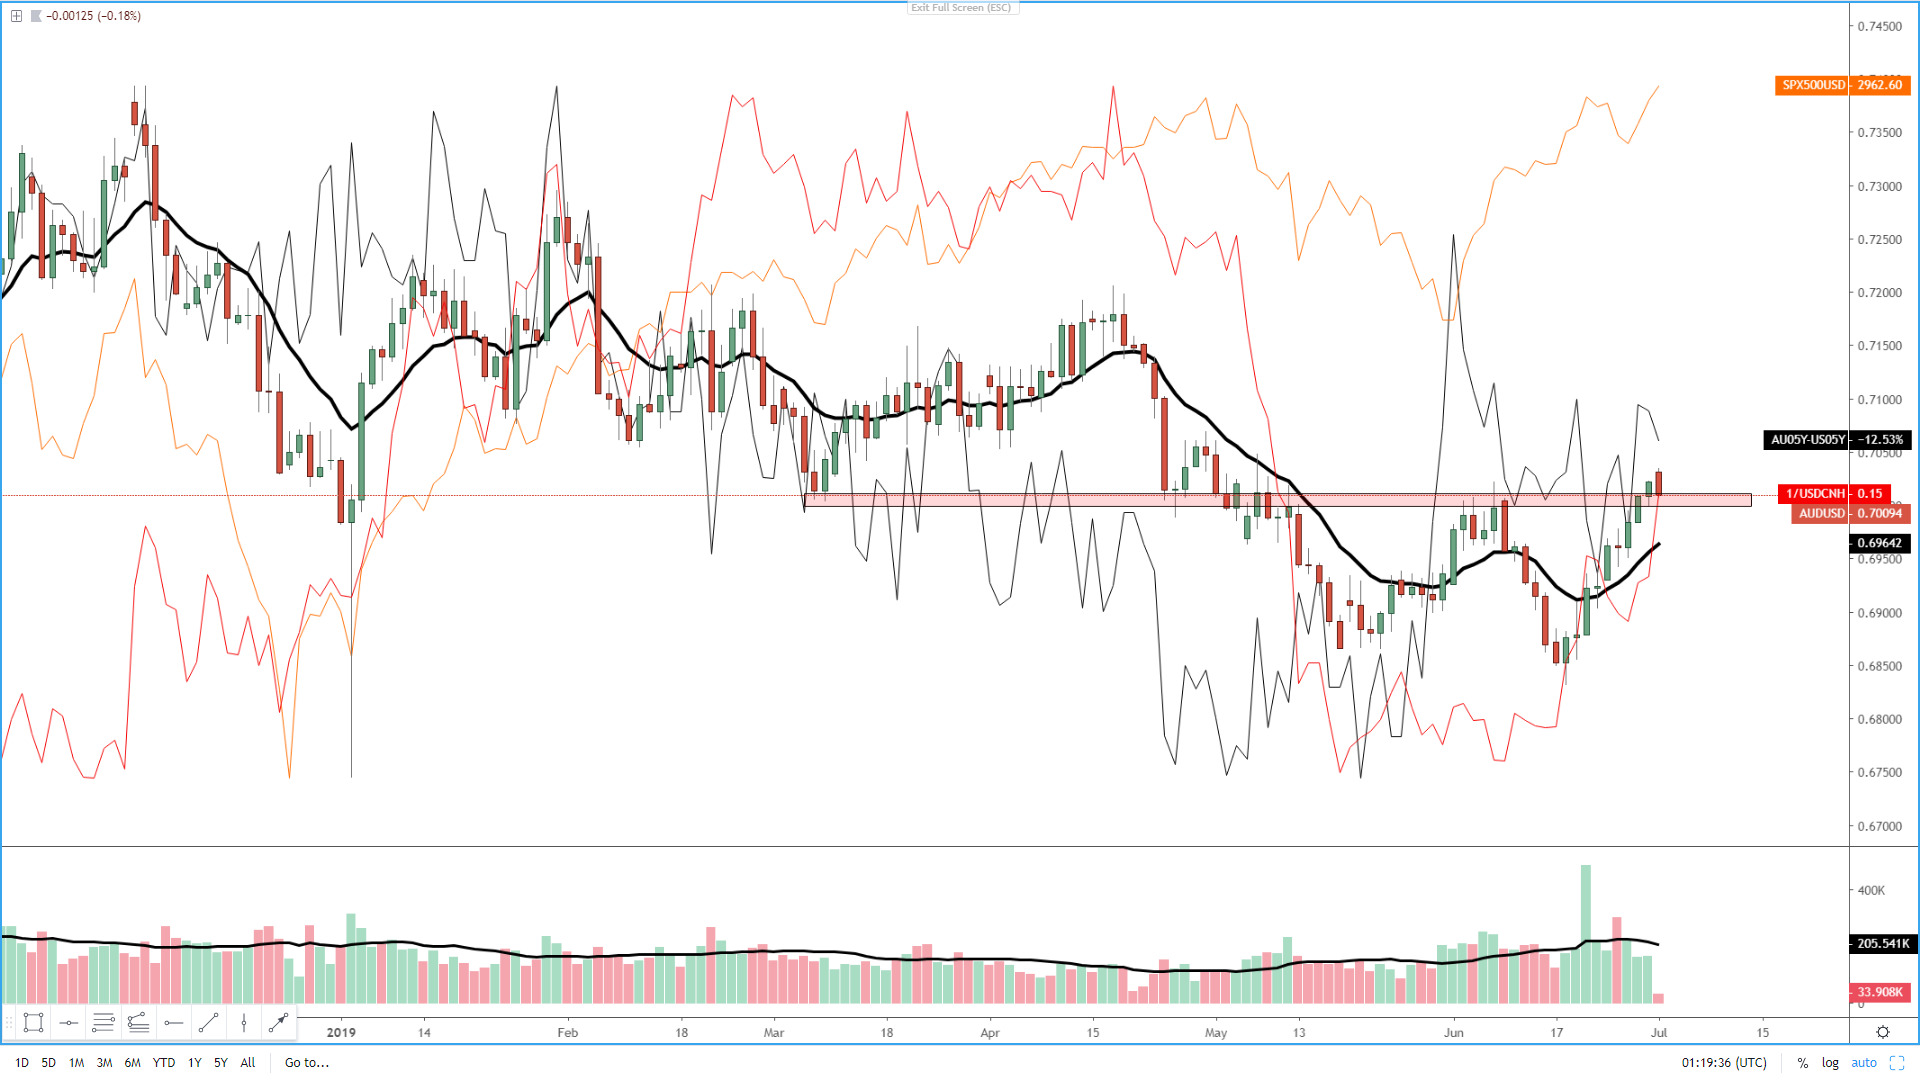
Important Footnotes
- Risk model: The fact that financial markets have become so intertwined and dynamic makes it essential to stay constantly in tune with market conditions and adapt to new environments. This prop model will assist you to gauge the context that you are trading so that you can significantly reduce the downside risks. To understand the principles applied in the assessment of this model, refer to the tutorial How to Unpack Risk Sentiment Profiles
- Cycles: Markets evolve in cycles followed by a period of distribution and/or accumulation. To understand the principles applied in the assessment of cycles, refer to the tutorial How To Read Market Structures In Forex
- POC: It refers to the point of control. It represents the areas of most interest by trading volume and should act as walls of bids/offers that may result in price reversals. The volume profile analysis tracks trading activity over a specified time period at specified price levels. The study reveals the constant evolution of the market auction process. If you wish to find out more about the importance of the POC, refer to the tutorial How to Read Volume Profile Structures
- Tick Volume: Price updates activity provides great insights into the actual buy or sell-side commitment to be engaged into a specific directional movement. Studies validate that price updates (tick volume) are highly correlated to actual traded volume, with the correlation being very high, when looking at hourly data. If you wish to find out more about the importance tick volume, refer to the tutorial on Why Is Tick Volume Important To Monitor?
- Horizontal Support/Resistance: Unlike levels of dynamic support or resistance or more subjective measurements such as fibonacci retracements, pivot points, trendlines, or other forms of reactive areas, the horizontal lines of support and resistance are universal concepts used by the majority of market participants. It, therefore, makes the areas the most widely followed and relevant to monitor. The Ultimate Guide To Identify Areas Of High Interest In Any Market
- Trendlines: Besides the horizontal lines, trendlines are helpful as a visual representation of the trend. The trendlines are drawn respecting a series of rules that determine the validation of a new cycle being created. Therefore, these trendline drawn in the chart hinge to a certain interpretation of market structures.
- Correlations: Each forex pair has a series of highly correlated assets to assess valuations. This type of study is called inter-market analysis and it involves scoping out anomalies in the ever-evolving global interconnectivity between equities, bonds, currencies, and commodities. If you would like to understand more about this concept, refer to the tutorial How Divergence In Correlated Assets Can Help You Add An Edge.
- Fundamentals: It’s important to highlight that the daily market outlook provided in this report is subject to the impact of the fundamental news. Any unexpected news may cause the price to behave erratically in the short term.
- Projection Targets: The usefulness of the 100% projection resides in the symmetry and harmonic relationships of market cycles. By drawing a 100% projection, you can anticipate the area in the chart where some type of pause and potential reversals in price is likely to occur, due to 1. The side in control of the cycle takes profits 2. Counter-trend positions are added by contrarian players 3. These are price points where limit orders are set by market-makers. You can find out more by reading the tutorial on The Magical 100% Fibonacci Projection