The U.S. dollar was broadly muted on Wednesday despite strong economic releases. Starting with the second revised estimates for the GDP, data from the commerce department showed that the U.S. economy advanced 3.3% in the quarter ending in September. This was above the forecast of a 3.2% increase.
Separately, pending home sales data showed a 3.5% increase on the month, beating estimates of a 1.1% increase for October. However, September's data was adjusted down to show a decline of 0.4%. The Fed Chair Janet Yellen testified in her prepared remarks that the central bank will be hiking interest rates this December.
Across the pond, the British pound surged following the news reports that the EU and the UK were likely to reach a settlement that was akin to progressing Brexit talks. No firm commitment has been made justyet but the British PM, Teresa May, is expected to visit Brussels on Monday to engage with her EU counterparts.
Looking ahead, economic data today will see the flash inflation estimates from the Eurozone. Both headline and core CPI rates are expected to rise higher following their weakening in the previous month. The U.S. core PCE data is also expected to be released later in the day.
EUR/USD intra-day analysis

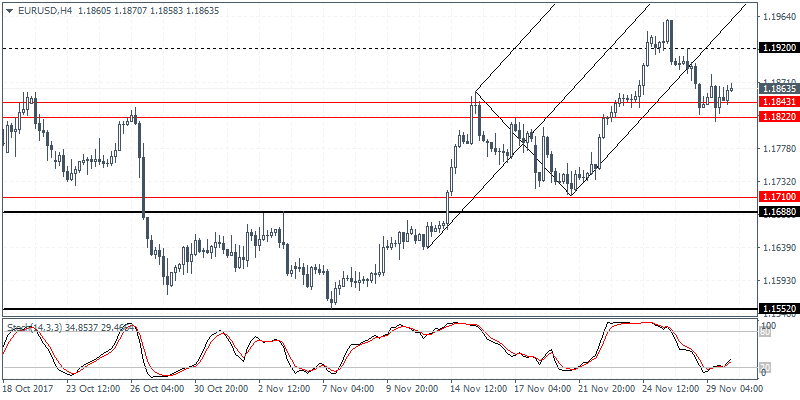
EUR/USD (1.1863):The euro stalled its two day decline yesterday, as price action closed with a spinning bottom candlestick pattern. Current attempts to minimise losses could see a short term rebound in price action to the upside. The reversal comes as EUR/USD was seen testing the support area near 1.1843 - 1.1822. This could mean a short-term retracement towards 1.1920 where a short-term support was formed. Establishing resistance here could signal further declines. While the support area of 1.1842 - 1.1822 remains, the initial downside target a break down below this level will send EUR/USD lower to testing the support area around 1.1710 - 1.1688. The bearish bias will shift if price manages to close above 1.1920.
USD/JPY intra-dayanalysis

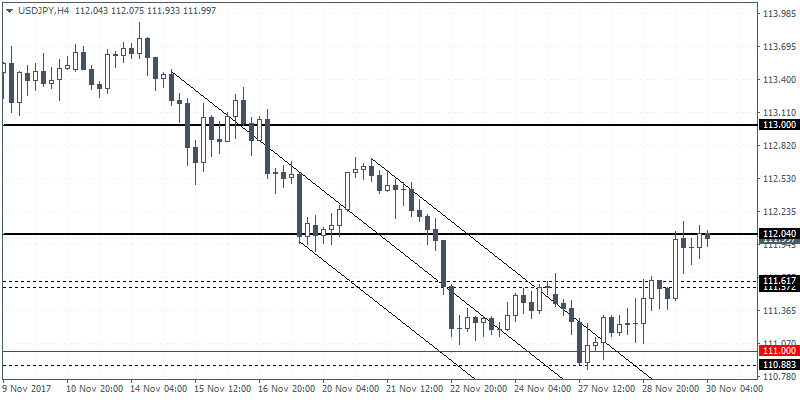
USD/JPY (111.99):The USD/JPY closed on a bullish note yesterday following the inside bar pattern that was formed on Tuesday. The upside momentum could continue but price action is seen testing the resistance level at 112.00. In the near term, USD/JPY could be seen giving up the short-term gains. Support is found at 111.61 - 111.57 region. USD/JPY will need to form a higher low around this level and breakout above the resistance area of 112.00to target the next main resistance level of 113.00. For the downside, in the event that the USD/JPY slips below 111.61 - 111.57 we expect a deeper test back to the previous support level near 111.00.
XAU/USD intra-day analysis

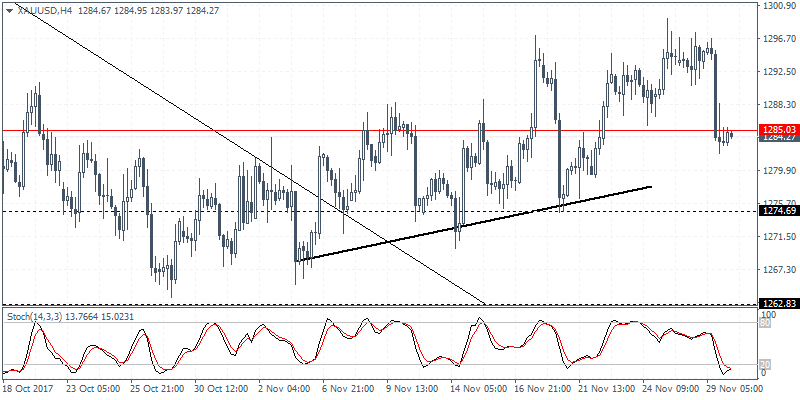
XAU/USD (1284.27):Gold prices gave up the gains as price action fell sharply back to retest the previously breached resistance level. Gold prices are currently trading slightly below the 1285 handle. Failure to trim the losses could see gold prices extending the weakness down to 1275 region where the support level has been firmly established. However, the Stochastics oscillator is currently oversold and could signal a hidden bullish divergence with the higher low in price and lower low on the Stochastics.
