
United Rentals Inc. (NYSE:URI) came up with better-than-expected results in the third quarter of 2017. The company’s earnings and revenues in the quarter also improved from the year-ago level buoyed by solid volume growth, record time utilization along with improved rental rates. Robust demand in the U.S. end markets and recovery in Canadian market also helped United Rentals post better numbers.
The company’s third-quarter 2017 adjusted earnings of $3.25 per share beat the Zacks Consensus Estimate of $3.00 by 8.3%. Earnings also increased 26% year over year.
Revenues
Total revenues of $1.77 billion surpassed the Zacks Consensus Estimate of $1.71 billion by 3.3%. Revenues increased 17.1% year over year.
Rental revenues were also up 16.2% from the year-ago quarter to $1.54 billion. Volume of equipment on rent increased 18.2% and rental rates inched up 0.1%.
United Rentals, Inc. Price, Consensus and EPS Surprise
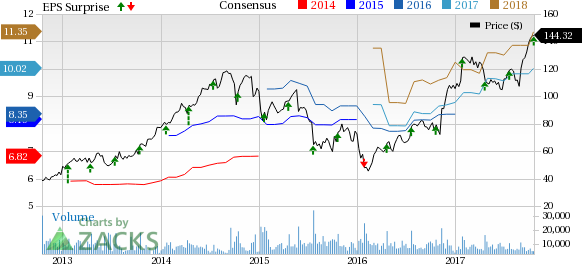
United Rentals, Inc. Price, Consensus and EPS Surprise | United Rentals, Inc. Quote
Segment Discussion
General Rentals: Segment rental revenues increased 12.8% year over year to $1.24 billion. Segment equipment rentals’ gross profit increased 11.9% to $525 million. However, gross margin declined 40 basis points (bps) year over year.
Trench, Power and Pump: The company’s Trench, Power and Pump specialty segment's rental revenues increased 32.9% year over year to $299 million, primarily on a same-store basis. Segment equipment rentals gross profit rose 40.2% to $164 million and gross margin improved 280 bps on a year-over-year basis.
Time Utilization & Fleet Size
Time utilization increased 160 bps to 71.9% from the year-ago level, marking a record third quarter for the company.
The size of the rental fleet was $10.76 billion of original equipment cost (OEC) as of Sep 30, 2017 compared with $8.99 billion as of Dec 31, 2016. The age of the rental fleet was 46.3 months on an OEC-weighted basis as of Sep 30, 2017 compared with 45.2 months as of Dec 31, 2016.
Margins
Total equipment rentals gross margin expanded 60 bps year over year to 44.9%.
Adjusted EBITDA improved 17.7% year over year to $879 million and adjusted EBITDA margin increased 30 bps to 49.8% in the quarter.
Balance Sheet
United Rentals’ cash and cash equivalents totaled $324 million as of Sep 30, 2017 compared with $312 million as of Dec 31, 2016.
In the quarter, the company generated $429 million of net cash from operating activities compared with $383 million for the same period last year.
2017 Guidance Updated
Fundamentally strong market and the contributions from acquisitions led the company to raise its 2017 views.
Total revenues are now expected in the range of $6.525-$6.625 billion, higher than the prior range of $6.25-$6.40 billion.
Adjusted EBITDA is projected between $3.10 billion and $3.15 billion compared with the prior expectation of $2.95-$3.025 billion.
Net rental capital expenditures after gross purchases are likely to be in the range of $1.25-$1.30 billion, higher than $1.05 billion to $1.15 billion expected earlier.
Net cash provided by operating activities is expected in the range of $2.275-$2.375 billion, more than $1.975 billion to $2.175 billion expected earlier.
Free cash flow is expected in the range of $925-$975 million, higher than $825-$925 million expected earlier.
Zacks Rank
United Rentals carries a Zacks Rank #2 (Buy). You can see the complete list of today’s Zacks #1 Rank (Strong Buy) stocks here.
Upcoming Peer Releases
Owens Corning (NYSE:OC) is slated to report quarterly results on Oct 25. The Zacks Consensus Estimate for the to-be-reported quarter is currently pegged at $1.26.
Louisiana-Pacific Corporation (NYSE:LPX) is scheduled to release quarterly results on Nov 6. The Zacks Consensus Estimate for the to-be-reported quarter is currently pegged at 76 cents.
Installed Building Products, Inc. (NYSE:IBP) is expected to report quarterly results on Nov 2. The Zacks Consensus Estimate for the to-be-reported quarter is currently pegged at 67 cents.
Today's Stocks from Zacks' Hottest Strategies
It's hard to believe, even for us at Zacks. But while the market gained +18.8% from 2016 - Q1 2017, our top stock-picking screens have returned +157.0%, +128.0%, +97.8%, +94.7%, and +90.2% respectively.
And this outperformance has not just been a recent phenomenon. Over the years it has been remarkably consistent. From 2000 - Q1 2017, the composite yearly average gain for these strategies has beaten the market more than 11X over. Maybe even more remarkable is the fact that we're willing to share their latest stocks with you without cost or obligation.
United Rentals, Inc. (URI): Free Stock Analysis Report
Installed Building Products, Inc. (IBP): Free Stock Analysis Report
Owens Corning Inc (OC): Free Stock Analysis Report
Louisiana-Pacific Corporation (LPX): Free Stock Analysis Report
Original post
Zacks Investment Research