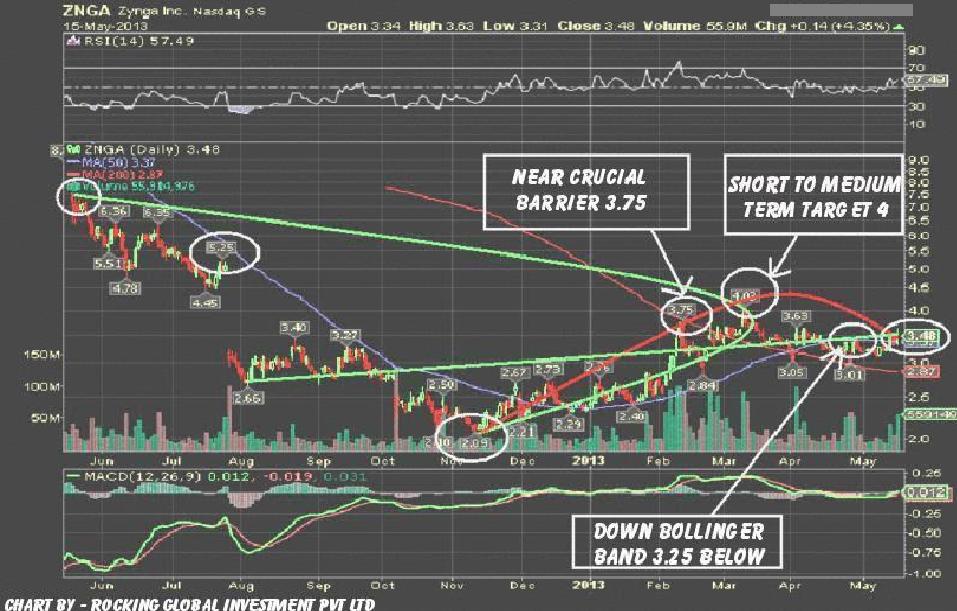
Zynga Inc. surged after hedge fund manager Barry Rosenstein said his Jana Partners had taken a new stake in the social games developer earlier this year. Zynga Inc. (ZNGA), is a provider of social game services with 240 million average monthly active users over 175 countries. Stock trading near 3.44.The Company develops markets and operates online social games as live services played over the Internet and on social networking sites and mobile platforms.
The Company's games are accessible on Facebook (FB), other social networks and mobile platforms to players globally, wherever and whenever they want. It operates its games as live services. Mark Pincus founded Zynga in April 2007 under the name Presidio Media; the company name changed to Zynga in July 2007. Zynga was named after an American Bulldog named Zinga once owned by Pincus. The company uses an image of a bulldog as its logo. All of its games are free to play and it generates revenue through the in-game sale of virtual goods and advertising.
In March 2012, the Company acquired New York-based social game developer OMGPOP, makers of the cultural hit mobile game, Draw Something, and over 35 additional social games. In 2012, the Company launched several new games, including Hidden Chronicles, Zynga Bingo, Scramble With Friends, Slingo and Dream Heights.
Earnings Trend
- Revenue: Revenue was $263.6 million for the first quarter of 2013, down 18% compared to the first quarter of 2012 and a decrease of 15% compared to the fourth quarter of 2012. Online game revenue was $229.6 million, a decrease of 22% compared to the first quarter of 2012 and a decrease of 16% compared to the fourth quarter of 2012. Advertising revenue was $34.0 million, an increase of 21% compared to the first quarter of 2012 and a decrease of 8% compared to the fourth quarter of 2012.
- Bookings: Bookings were $229.8 million for the first quarter of 2013, a decrease of 30% compared to the first quarter of 2012 and a decrease of 12% compared to the fourth quarter of 2012.
- Net income (loss): Net income was $4.1 million for the first quarter of 2013 compared to a net loss of $85.4 million for the first quarter of 2012. Net income for the first quarter of 2013 included $29.9 million of stock-based expense compared to $133.9 million of stock-based expense included in the first quarter of 2012.
- Adjusted EBITDA: Adjusted EBITDA was $28.7 million for the first quarter of 2013 compared to $86.8 million for the first quarter of 2012 and $45.0 million in the fourth quarter of 2012.
- Non-GAAP net income: Non-GAAP net income was $9.1 million for the first quarter of 2013, down from $47.0 million in the first quarter of 2012 and up from $6.9 million in the fourth quarter of 2012.
- EPS: Diluted EPS was $0.00 for the first quarter of 2013 compared to ($0.12) for the first quarter of 2012 and ($0.06) for the fourth quarter of 2012.
- Non-GAAP EPS: Non-GAAP EPS was $0.01 for the first quarter of 2013 compared to $0.06 for the first quarter of 2012 and flat when compared to the fourth quarter of 2012.
- Cash and cash flow: As of March 31, 2013, cash, cash equivalents and marketable securities were approximately $1.67 billion, compared to $1.65 billion as of December 31, 2012. Cash flow from operations was $26.4 million for the first quarter of 2013, compared to$78.8 million for the first quarter of 2012. Free cash flow was $23.2 million for the first quarter of 2013 compared to $43.8 million for the first quarter of 2012.
- Share Repurchase Program: During the three months ended March 31, 2013, Zynga repurchased approximately 1.0 million shares of common stock for approximately $2.5 million under its stock repurchase program. From inception of the program Zynga has repurchased a total of approximately 6.0 million shares for $14.3 million. The remaining authorized amount of stock repurchases that may be made under this plan was approximately $186 million as of March 31, 2013.
- Repayment of Debt: In April 2013, we repaid our long-term debt of $100 million and currently have no debt outstanding.
- Revenue is projected to be in the range of $225 million to $235 million.
- Net loss is projected to be in the range of $36.5 million to $26.5 million.
- EPS is projected to be in the range of ($0.05) to ($0.03), based on a share count of approximately 785 million to 795 million shares.
- Bookings are projected to be in the range of $180 million to $190 million.
- Adjusted EBITDA is projected to be in the range of ($10) million to break even.
- Non-GAAP EPS is projected to be in the range of ($0.04) to ($0.03), based on a share count of approximately 785 million to 795 million shares.
From Last two month, the stock was trading on 200 days SMA it’s a positive matter for short to medium term. Technically, the stock creates a format of rectangle in down trend it indicated that stock long term bullish trend will start just on near crucial resistance 3.75. You can see more up side level 4.04 and 4.50 if it cross 3.75 and close on it. 
