🚀 AI-picked stocks soar in May. PRFT is +55%—in just 16 days! Don’t miss June’s top picks.Unlock full list

Dome Patterns Now Abound On Indexes, ETFs, Stocks

Published 10/15/2015, 12:31 AM
Updated 07/09/2023, 06:31 AM
DJI
-
US2000
-
MTW
-
IXIC
-
OEX
-

During the throes of the 2008 bear market, I looked back at the Russell 2000 aghast and wondered to myself: how could I have missed something this obvious? Not to say that I wasn’t short and having a great year. On the contrary, it was (not surprisingly) the best trading year of my life. But the clarity of the pattern made me wonder why I didn’t just pour my life savings into RUT puts and make a quadruple-digit percentage gain.
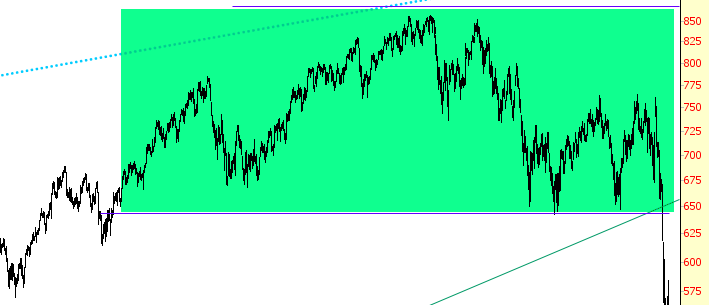
RUT Chart

I vowed never to let something so “obvious” get away from me again.

Hence my fortitude with respect to the current market. In spite of countertrend rallies (sometimes, like yesterday, multiple ones in the course of a single trading session), I am standing firm. I have my portfolio scattered, at the moment, over 136 different short positions, and I’m probably going to expand that to 150. There are simply too many good charts.

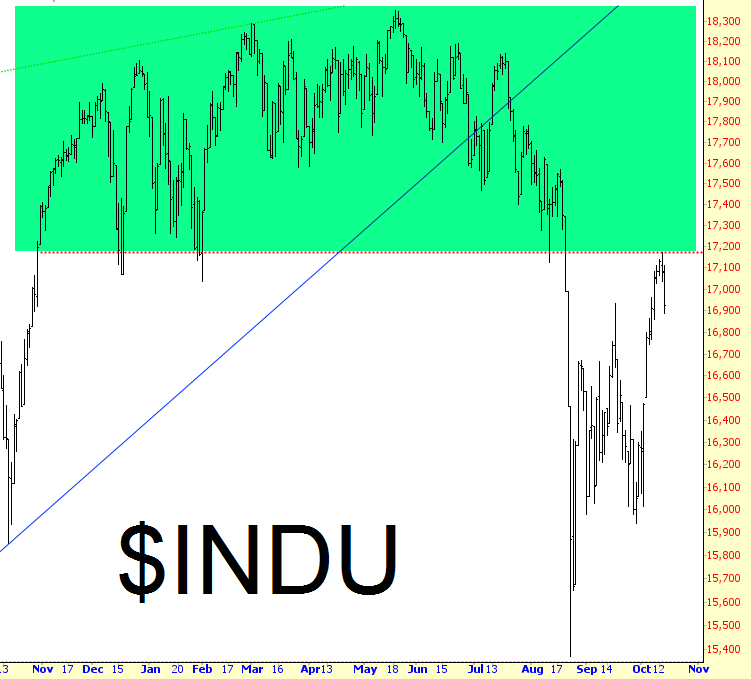
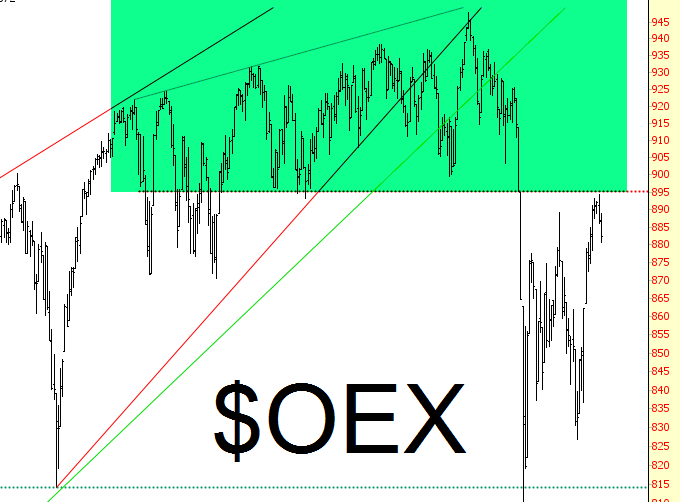
The guiding light to all of these positions is the huge dome pattern found on index after index, ETF after ETF. For instance, the NASDAQ Composite:
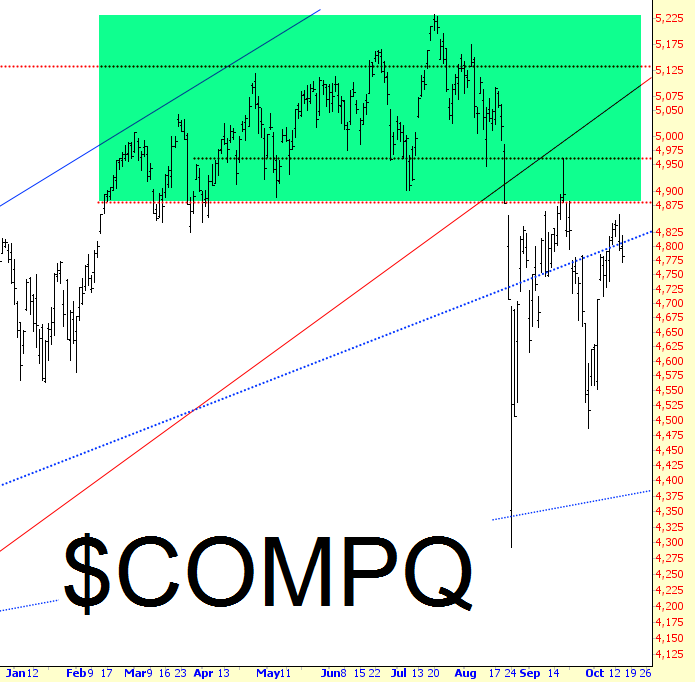
COMPQ Daily

The Dow Industrials:

INDU Daily

And the S&P 100:

OEX Daily

For some bizarre reason, I have vowed to myself not to hold ETF positions overnight, but instead focus strictly on the very best individual equity positions. One example among these 136 is Manitowoc (N:MTW), which after hours is down about 6% as of this post.
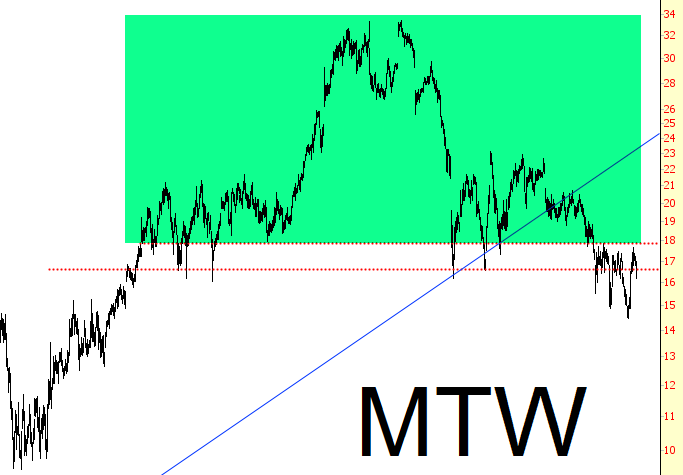
MTW Daily

Latest comments

Loading next article…
Risk Disclosure: Trading in financial instruments and/or cryptocurrencies involves high risks including the risk of losing some, or all, of your investment amount, and may not be suitable for all investors. Prices of cryptocurrencies are extremely volatile and may be affected by external factors such as financial, regulatory or political events. Trading on margin increases the financial risks.
Before deciding to trade in financial instrument or cryptocurrencies you should be fully informed of the risks and costs associated with trading the financial markets, carefully consider your investment objectives, level of experience, and risk appetite, and seek professional advice where needed.
Fusion Media would like to remind you that the data contained in this website is not necessarily real-time nor accurate. The data and prices on the website are not necessarily provided by any market or exchange, but may be provided by market makers, and so prices may not be accurate and may differ from the actual price at any given market, meaning prices are indicative and not appropriate for trading purposes. Fusion Media and any provider of the data contained in this website will not accept liability for any loss or damage as a result of your trading, or your reliance on the information contained within this website.
It is prohibited to use, store, reproduce, display, modify, transmit or distribute the data contained in this website without the explicit prior written permission of Fusion Media and/or the data provider. All intellectual property rights are reserved by the providers and/or the exchange providing the data contained in this website.
Fusion Media may be compensated by the advertisers that appear on the website, based on your interaction with the advertisements or advertisers.
© 2007-2024 - Fusion Media Limited. All Rights Reserved.