A bit of a choppy week for markets which corrected a bit before looking to have put in a bottom then flipping back to looking like more downside was needed before a large gap opening Friday on good job numbers.
I’m still not so sure a low is in yet, but we will know by Wednesday at the latest.
I am still expecting a big run into the end of the year but I have to follow the market no matter where it goes.
As for gold and silver they dropped right on schedule as the chart suggested and as so often happens the move began overseas while I was sound asleep Sunday night.
If you really want to trade gold and silver then living in Europe would be much more conducive to this unless you like to stay up all night.
Let’s check the precious metals charts and see the ugly action that marred the week.
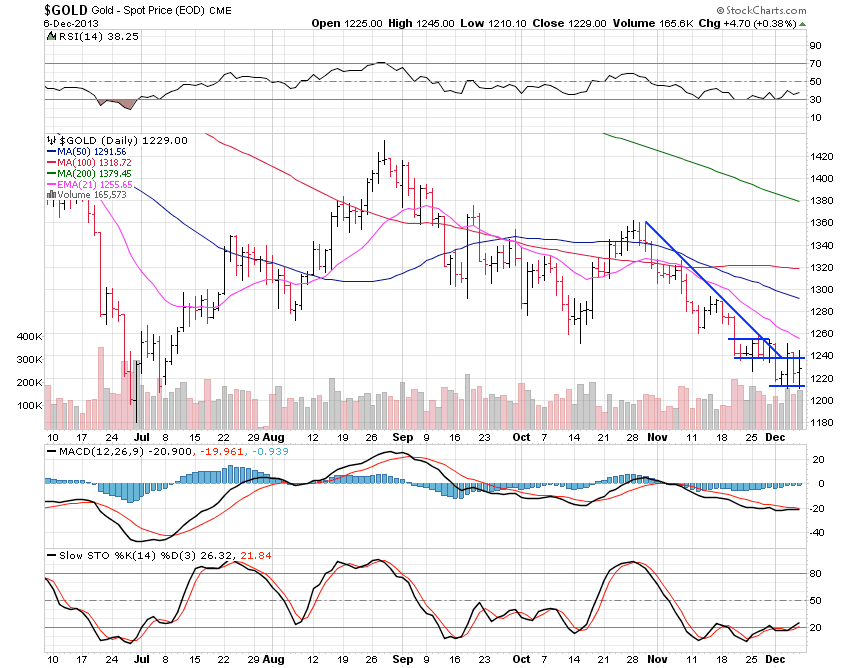
Gold fell 1.79% for the week and is just plain ugly.
The big break started Sunday night and continued throughout Monday before finding a floor which held for the week.
Wednesday saw a huge pop back up into the broken bear flag before falling back. As with real pop, this move fizzled out quickly.
Gold is setting up another bear flag here which tells me a low is not yet in.
The action is very ugly here and we should soon test the 2013 lows at $1,179.
When we do I will be keenly watching it’s action since a move under that low and then move above $1,180 on a closing basis with strong volume would tell me a double bottom is likely in.
That said though, if we can’t put a double bottom in then we are heading back to the $1,000 area as I’ve talked about was possible here repeatedly this year.
2014’s tone will be decided here in the next week or two. If we put in a double bottom, 2014 
It should be a great year. If not then we will have a few months at least, of weakness to start 2014.
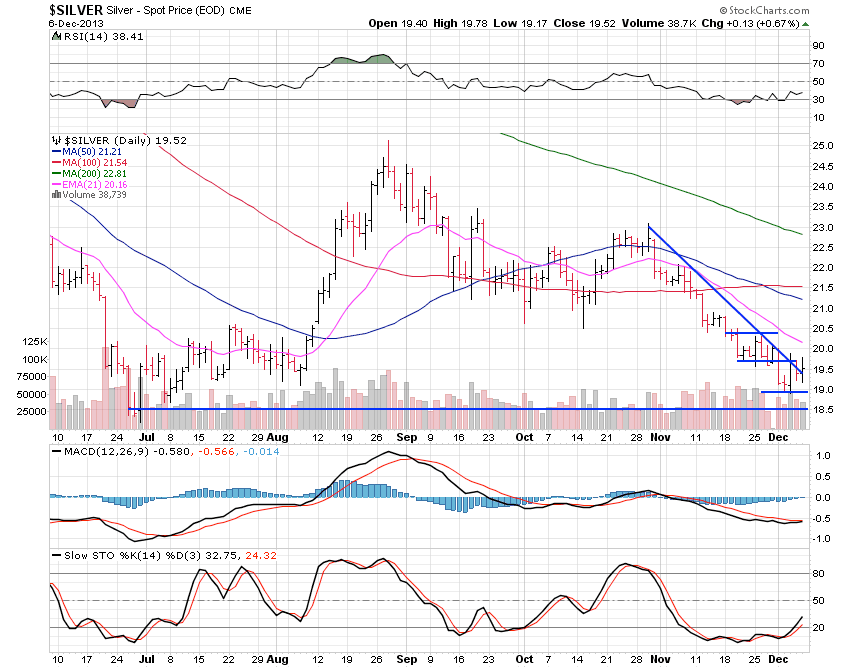
Silver slid 2.38% for the week and is also showing me another bear flag formation unfortunately.
Looks to me like we are still heading to $18.50 and the perhaps $15 if we can’t hold there.
It’s just very poor action here unless you are a gold and silver bear.
I don’t think gold and silver are done in their secular bull market but they are sure struggling at the moment.
In my view we are much closer to a bottom than a top.
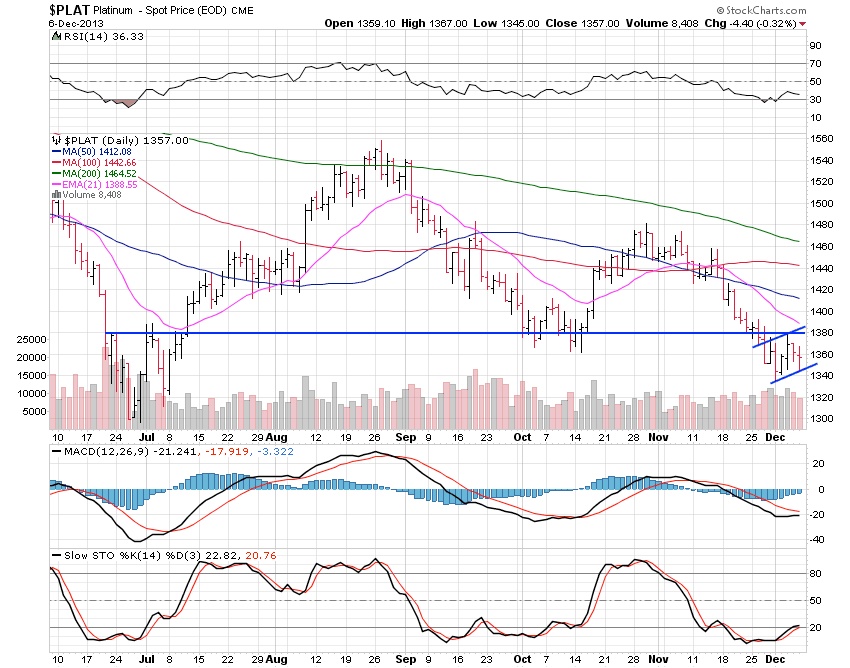
Platinum only dropped 0.37% for the week and remains below a major resistance level at $1,380.
Platinum has tried to move back above $1,380 to no avail and it’s setting up a very bearish pattern here, the coveted bear flag.
Platinum looks very bad at the moment and looks set to test support from way back in 2006 and 2007 at $1,260.
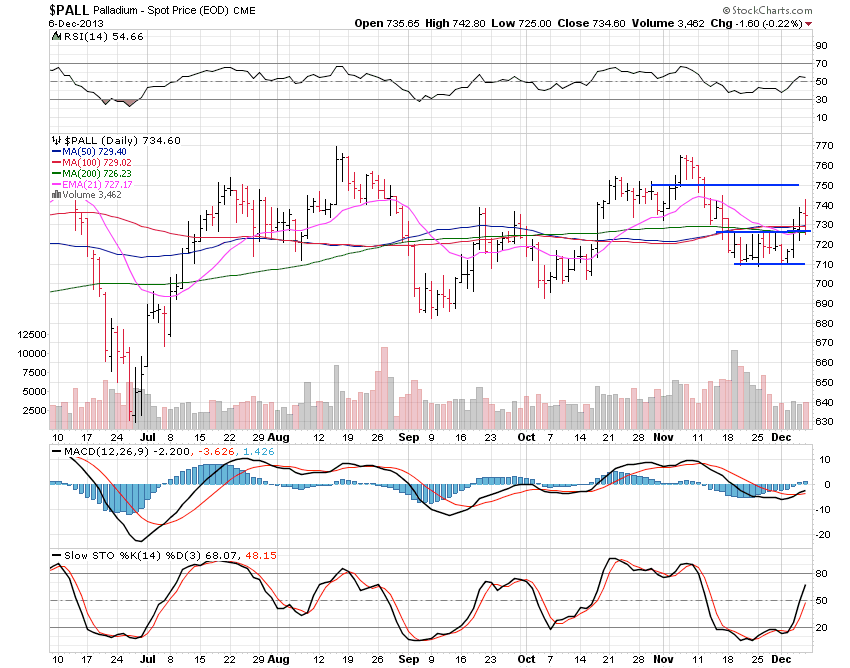
Palladium shed the weakness and rose 2.21%. It’s not everyday we see one of the metals diverge from the others but most often when we do, it’s palladium.
The $750 level has some resistance so expect a few days of consolidation around there before we see palladium move to $770.
With gold and silver so weak though we always have to beware of this being a false breakout.
As has been the case in most of 2013 I am not trying to trade the precious metals. There are much easier fish to fry and I’m off now to look for the big winners, before they become big winners.