Quarterly Net Income
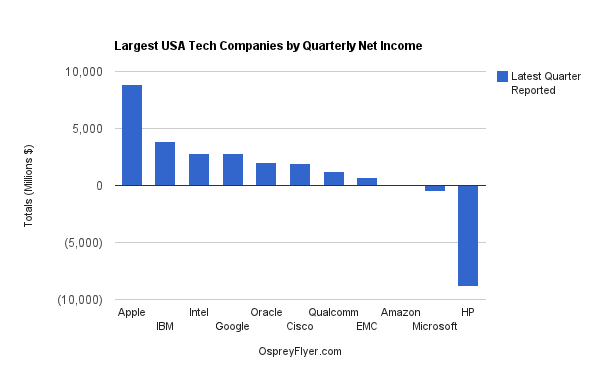
The Largest U.S.Tech Companies have reported quarterly aggregate net income of $14.8 billion, which is lower than the prior quarter $35.6 billion. This is a sequential QoQ decrease of -$20.8 billion and -58%! What happened? HP reported an epic quarterly net loss of -$8.9 billion, which offset the Apple quarterly net income of +$8.8 billion. Microsoft reported a rare quarterly net loss of -$492 million. Eight of the eleven companies reviewed reported a QoQ decrease in net income.
A net decrease is not unusual or unexpected as summer is typically a slower financial performance on an annual cyclical basis for the tech sector. But the huge HP and extraordinary Microsoft net losses created a plunge. The only three sequential QoQ increases were IBM (+$816 million) and Intel (+$89 million) and EMC (+$63 million).
For the latest quarters reported, Apple continues dominating with an incredible $8.82 billion quarterly net income. Second was IBM at $3.88 billion, third was Intel at $2.83 billion, and fourth was Google with $2.79 billion. Apple earned more than #2 IBM and #3 Intel combined.
The rest of the pack follows with #5 Oracle at $2.03 billion, #6 Cisco at $1.92 billion, #7 Qualcomm at $1.02 billion rounding out the Billion Dollar Club. Trailing are #8 EMC at $689 million and #9 Amazon at a mere $7 million. Further behind are #10 Microsoft at a dismal net loss of -$492 million and #11 HP with the aforementioned epic loss of -$8.86 billion. Apple comprises approximately 60% of the total quarterly net income of the 10 tech companies listed!
Return On Assets
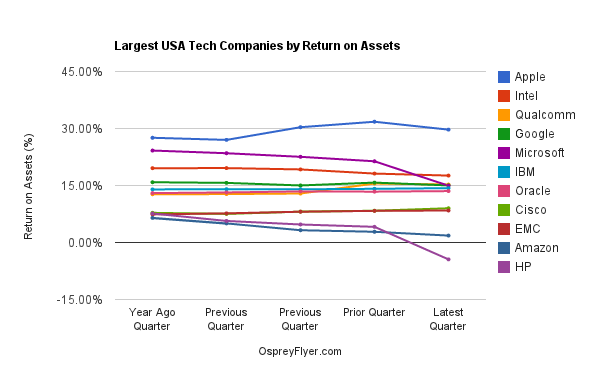
The Largest U.S. Tech Companies have reported an average return on assets of +12.29%, a multi-quarter low and -1.68% decrease from the prior quarter. Seven of the eleven companies reviewed reported decreases. The largest sequential QoQ decreases were HP (-8.564%), Microsoft (-6.42%), and Apple (-2.08%). The only significant sequential QoQ increase was Cisco (+0.65).
For the latest quarters reported, Best of Breed goes to Apple with a commanding and incredible lead of at +29.70% ROA. Apple is distantly followed by Intel (+17.61%), Qualcomm (+15.26%), and Google (+15.02%), and Microsoft (+14.95%). Next are #6 IBM (+14.30%), and #7 Oracle (+13.53%).
Significantly lagging the field are #8 Cisco at +9.01% and #9 EMC at +8.42%. Amazon is #10 and a much lower +1.82%. Finally, HP is last and #11 at a negative -4.44%. 
I have included Amazon because of the Kindle Fire, streaming, cloud services, and the resulting competition with others listed.
Status
Updated through Oracle quarterly financial results reported 9-20-12
Next reports: October earnings season
